Market Insights: Doctor Copper
Milestone Wealth Management Ltd. - Mar 01, 2019
For those unfamiliar with economic indicators, you are likely wondering what the metal copper and doctor have to do with one another. Well, as Investopedia states: "The term Doctor Copper is market lingo for the base metal that is reputed to have a P
For those unfamiliar with economic indicators, you are likely wondering what the metal copper and doctor have to do with one another. Well, as Investopedia states: "The term Doctor Copper is market lingo for the base metal that is reputed to have a Ph.D. in economics because of its ability to predict turning points in the global economy. Because of copper's widespread applications in most sectors of the economy — from homes and factories to electronics and power generation and transmission — demand for copper is often viewed as a reliable leading indicator of economic health." Many investors look at the price of copper for a read on global demand, and thus, future economic strength.
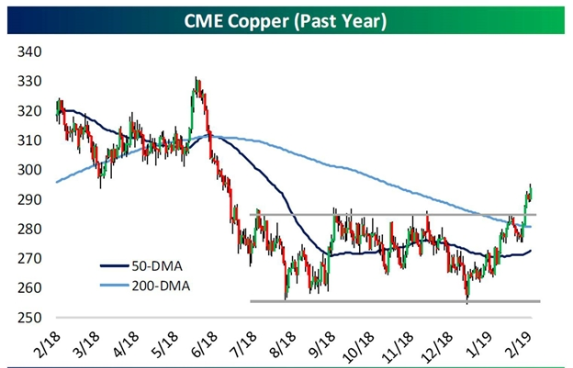
The price of copper was in a long-term downtrend from 2011 to 2016. It recovered nicely from mid-2016 to the end of 2017, but then faltered last year along with equities. We have recently seen a strong resurgence in the metal, with a solid breakout of resistance that has been in place since the middle of last year (see chart below). In our view, it also keeps the intermediate-term uptrend that began in late 2016 back in play, and potentially sets a longer-term uptrend in motion. In addition, the 50-day moving average price of copper just crossed over the 200-day moving average (known as a very positive chart signal called a golden cross).
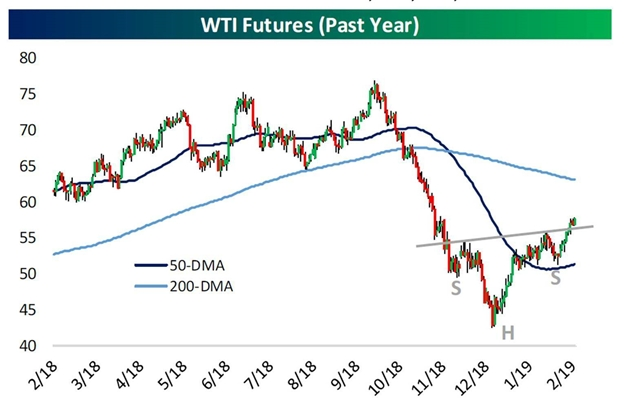
In addition to positive price action from copper in February, the price of oil is also showing the potential completion of a positive chart formation called a reverse head and shoulders pattern. You can see in the following chart what this pattern looks like. The recent rise above the resistance trendline from that pattern bodes well for future price action.
This also should be viewed as a positive signal for Canada and especially Alberta. With the secular bull market in equities likely well into the back half, cyclical industries tend to begin to outperform (based on past cycles). From a relative strength position, the probability of the S&P/TSX Composite performing better relative to U.S. Equities rises on a go-forward basis, as our overall economy has a higher weighting towards cyclical industries. It should come as no surprise then, based on the downtrend of the price of copper from a high in February 2011 to a low in January of 2016, that Canadian equities underperformed U.S. equities in each of those calendar years (2011-2016). With the recovery of copper in 2016, Canadian equities finally outperformed U.S. equities for the first time in six calendar years. The last two calendar years have seen U.S. equities outperform Canada once again, but with the recent major technical move in copper, coupled with some relative weakening in the U.S. technology space, we are hopeful that we see strength in our equity market once again.