Market Insights: Retest?
Milestone Wealth Management Ltd. - Jan 25, 2019
While we understand that a retest of the Dec. 24th low is certainly a possibility, we are seeing many positive developments when it comes to the overall breadth and upside volume of the market, as well as some positive leading technical indicators.
While we understand that a retest of the Dec. 24th low is certainly a possibility, we are seeing many positive developments when it comes to the overall breadth and upside volume of the market, as well as some positive leading technical indicators. The three-day intense selling session that ended on December 24th, by our measure, was one of the worst in the last fifty years. Based on our research, it is quite rare for similar past instances to be retested with a negative outcome. In addition, our Milestone Recession Risk (MRR) Composite remains above our cautionary level of 5/10, currently sitting at a level of 6.0 (higher the better).
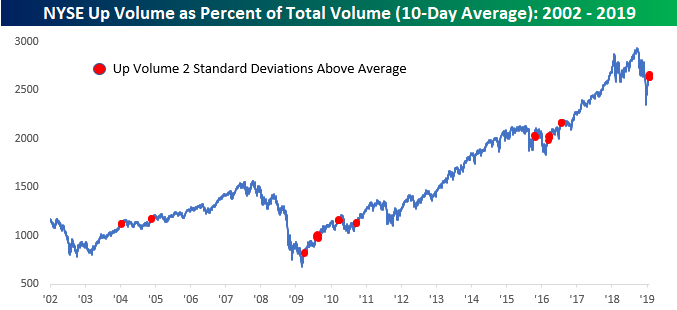
Speaking of breadth and volume, if we look at the 10-day average of NYSE up volume as a percent of total volume, it has recently exploded to the upside from a very depressed level. In late December it was very close to the most negative reading going back to at least 2002 (for which we have data). Since then it has gone from more than two standard deviations below to more than two standard deviations above the long-term average, peaking out above 65% which is the highest reading since at least 2002. Based on data crunching from the astute Bespoke Investment Group, there have been 44 prior readings since 2002 where the reading has been more than two standard deviations above the long-term average. The performance of the S&P 500 over the short-term (next month) in those instances has been positive 93% of the time. We don't typically worry about very short term periods like week to week, but what is interesting here is that prior periods, like now, have typically been fairly close to longer-term lows (see chart below), so this is a positive.
We have also discussed the Advance-Decline (AD) Line in past missives as one of the more important breadth indicators. To refresh, this indicator helps to gauge the strength of the underlying trend of the stock market. It calculates net advances, which is the number of advancing stocks less the number of declining stocks for a market. The AD Line is a cumulative measure of these net advances. During the week of December 24th, the AD Line reached a reaction low but reversed to the upside to end the week higher, creating what is known as a one-week bottom reversal. All stock market indices reached new reaction lows in December exceeding their prior respective 2018 calendar lows. The AD Lines, on the other hand, held significantly above their early 2018 lows. This is a positive divergence between stock market indices and their AD Lines, which typically signals that an important low was reached, so we will see if that plays out.
Lastly, on the technical indicator side, the venerable Lowry Research Corporation, which has been providing important technical investment advice to market participants since 1938, published a report last week that really caught our attention. Lowry's Short Term Index (STI) is their well-known proprietary short-term measure of investors' demand for equities. This indicator typically sits between a level of 60 and the low 90s. It is considered oversold when below 60 and the opposite starting in the 90s and hitting over 110 on just few occasions in history. As you can imagine by reading the above, this level dipped below 60 on December 24th. And although currently short-term overbought after the recent rebound, what may be important at this point in time is how quickly it reversed from the oversold level on December 24th. It rose 44 points in just over a three week span. Going back to 1940, as their chart shows below, a 40+ point expansion of their STI over a period of less than one month has only happened nine times in history prior to today. With the recent double digit percentage pop in the S&P 500, it would be very reasonable to assume this can't be maintained. Although we agree that we are due for a short-term pull back, the data below suggests this strong trend may continue. The forward one and two-year percentage gains on the S&P 500 are particularly eye popping. Also of note: of the nine prior occurrences, only one had a full retest of the low.
