Market Insights: Third Quarter Wrap-up
Milestone Wealth Management Ltd. - Oct 12, 2018
Market Update
The third quarter of the year tends to be the weakest, but that definitely was not the case specifically for the US equity market. This past quarter was one of its strongest in years, with the S&P 500 advancing 7.2% (or about 5.4% in CAD). We also saw strength in Japan up 8% on the quarter. Outside of those two regions, on the other hand, returns were muted. The S&P/TSX Composite declined 1.25% and the MSCI Europe/Asia/Far East (EAFE) Index dropped 1% (in CAD). The bulk of the MSCI EAFE decline came from Europe. Lastly, it was the emerging markets space that really struggled, declining 3.7% (in CAD). On a year-to-date basis, the S&P/TSX Composite and the MSCI EAFE are down 0.8% and 0.7% on a price return, while the S&P 500 and Nikkei are up 9% and 5.9%. We will note, however, that the return for the US market is somewhat misleading, in that two thirds of the return have come from ten technology companies, namely Amazon, Alphabet, Apple and Microsoft.
Credit markets have struggled this year in a rising interest rate environment. Bond/treasury prices have an inverse relationship with interest rates. There now seems to be fairly clear evidence that the 35 year secular bull market in bonds is over. For some time now, our portfolios have been geared down to have a lower duration and more corporates, to lower the interest-rate sensitivity of our portfolios. The FTSE TMX Canadian Bond Universe was down a half percent after the third quarter, while the Bloomberg Barclays US Aggregate Bond Index was down even more at -1.6% which is a large decline for this market.
In commodity markets, we have seen a nice run for oil with WTI Crude prices rising 21% this year to US$73/bbl. Unfortunately, this hasn't exactly resulted in big equity returns for Canadian investors, as the S&P/TSX Energy Index is only up 2% YTD on a total return basis. If oil prices stay and trend towards US$80, however, we could see that change for the better. On the other side of the commodity spectrum, Gold prices are down over 8% this year.
Milestone strategy and outlook
Before we discuss the two areas we wanted to bring light to, namely the US service sector and leading and coincident indicators, we would be remiss not to start with what we have witnessed over the last couple weeks. Although we have seen a return to volatility as October has kicked off with a sharp correction in the equity markets eerily similar to what we saw in Jan/Feb, we continue to reiterate our long-term view that we remain in a secular bull market and that many factors that are identifiable at the beginning of a credit-led recession are simply not present.
There seems to be two credible ‘reasons’ behind the correction this past week, one that has received much media attention and one perhaps not so much. The US 10-Year Treasury rate briefly hitting 3.25% (currently 3.16%) has grabbed headlines and has many trying to find the elusive level that could cause a credit crunch and bring on a recession. The other potential reason for what caused the indiscriminate selling is that China is selling vast amounts of their US Treasury holdings. Why? It has negative effects for the US, it helps China’s currency and they obtain cash to spend freely. What is the potential result? Selling such a high volume of US Treasury holdings pushes US interest rates higher, which in turn can hurt the US consumer and ultimately affect equity prices in the short-term. Furthermore, China then obtains billions of dollars which allows them to purchase renminbi, supporting its value in international markets, and with that renminbi they can spend it inside their country to stimulate their own economy. It is possible that once this selling eases, which it will, we could see a major rally in U.S. financial markets.
We say ‘elusive’ above because we believe simply looking at this level (10-year Treasury interest rates), which many media pundits are preaching, is not as useful as using numerous important leading indicators as an aggregate predictor. The best way we can describe this is to highlight five indicators, provided by Canaccord’s North American Strategist Tony Dwyer, that offer the best guide to when a recession could be approaching. None of these indicators have been triggered yet, and thus their lead times have not started giving us comfort on our positive fundamental thesis on the markets.
Inversion of the yield curve: In the past seven cycles, an inversion of the yield curve has been the most reliable at predicting an oncoming recession. Looking at past cycles with relatively low inflation levels, the median lead time to recession has been 31 months. An inversion hasn't happened yet.
Fed Senior Loan Officer Survey: In the most recent survey, the Fed found that banks actually eased their lending standards for both small and large business even though we are in one of the longest expansions in history. Until both of these switch to a net percentage of respondents tightening standards for commercial and industrial loans, there is little concern based on the history of this indicator.
Small Business Optimism: We discussed the NFIB Small Business Optimism Index in our last quarterly market commentary, which is the broadest measure of sentiment among small business owners in the US and the driver of the US economy and employment. It recently hit a new cycle and record high in August. Data shows that the cycle peak in this index leads recessions by a median of 41 months; that is - if August indeed ends up being the peak of this cycle.
Manufacturing Optimism: In one of our recent Market Insights blog post, we described the surging growth for US manufacturing. The ISM Manufacturing Survey Index, the most widely followed in this space, hit a new cycle high in August. Based on past cycles, this index peak has led US recessions by a median of 31.5 months.
National Financial Conditions Indices: This is another topic we discussed in our last market commentary; The Fed has three indices that compile 105 credit stress indicators in the banking system and financial marketplace. Although these can change quickly, there has never been a recession without all three of these indicators showing above average credit stress levels. At present, they are all still near historically low stress levels.
We say this regularly in these missives, but we continue to focus on the underlying picture which we still view as positive, rather than all the constant noise. By following the media, one would think we live in a doom-and-gloom world, but nothing could be further from the truth. We say this for a reason, and there are some great examples of this at play, whether it is in the investing world or simply the world in general.
To illustrate this, if you look at the markets, there was a recent survey done by a firm called Betterment, where they asked approximately 2000 respondents if they thought the stock market (S&P 500) had gone up over the past 10 years. The result is that 48% thought it had not gone up at all while 18% actually thought it had declined. We know that the S&P 500 is up 210% over the past 10 years (Sep. 2008-2018, total return basis in USD), and even if you go by the last market peak in October of 2007, it is up almost 140%. How could two thirds of respondents be so wrong?
The constant barrage of ominous sounding online news continually hitting us from every angle makes all negative events seem far more likely to happen to us and far more prevalent than they actually are in reality. People generally have the unfortunate tendency to notice and be affected by the negative rather than the positive, and the bottom line is that most people think things are worse than they really are. There is an interesting recent book called ‘Factfulness’, written by Hans Rosling, that attempts to shine light on people’s inability to see the world as it actually is, and that ‘Factfulness’ should be part of everyone’s daily life, no different than say a healthy diet or regular exercise. Of all the surveys done in the book, one that particularly stood out to us was the question ‘”Of the world population, what percentage live in low-income countries?” The average guess to this question was that 59% of people in the world live in extreme poverty, while the correct answer is just 9%. While it is true that way back in 1997, 42% of the population of India and China lived in extreme poverty, the reality now is that as of last year those numbers dropped to 12% and 0.7% respectively. This is another example of the negatively distorted view of the world.
Why are we saying all of this in the context of investing? Because we all tend to look in the rear-view mirror more often, we must do our best to consciously focus on what lies ahead. The best way we know how to do that as portfolio managers is to use objective indicators that have been reliable in leading very difficult market periods and especially oncoming recessions. Our Milestone Recession Risk Composite continues to show recession risk to be at a relatively low level. We will continue to monitor this closely as rising inflation and interest rates are becoming more of a concern, and as trade wars potentially slow global growth.
We will finish off by discussing two important indicators that we mentioned right off the top, the US service sector and leading/coincident indicators.
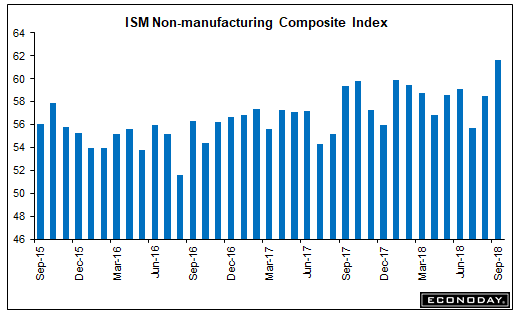
The services sector is obviously an important part of the US economy. In fact, it accounts for close to 80% of US private sector GDP. It stands to reason then, that the widely followed Institute For Supply Management (ISM) Non-manufacturing Composite is an important gauge of the overall health of the world’s largest economy as the bulk of the composite is services. The ISM surveys more than 375 firms from numerous sectors across the country. Led by a 14-year high in business activity and a record high in employment, the composite posted its strongest reading yet since it was established in 2008 (the survey itself goes back to 1997). In our view, this is as strong a signal as any on the overall health of the US economy. (see chart below)
The other indicator we wanted to mention is the US Conference Board’s Leading Economic Indicator, which we have discussed in our past blog posts as well. The recent readings have been strong, but we wanted to highlight a different way of looking at the indicator, which is using the ratio of the Leading to Coincident Indicators (LEI/COI). The Conference board publishes not only its Leading Economic Indicator, but also Coincident and Lagging. Using the LEI/COI provides an even better leading indicator than the leading indicator itself. As you can see in the next chart, a recession typically follows a peak in this ratio once it has fallen for a period of time. Usually the ratio peaks more than a year before a recession occurs and has fully rolled over by then. Right now, we are still at a peak in this ratio.

We can also look at the year-over-year change for the Conference Board’s Leading Economic Indicator. As can be seen in the last chart below, in the past this reading peaks and declines months or even years prior to a recession. The last August reading came in at 6.41% which is the second highest level since July 2014. Two positive things to note here are that before a recession, this indicator has never been on the rise like it is now, and also, since 1980, we have never seen a recession occur in less than 24 months following a reading of 5% or better, with the average amount of time away from a recession being 35 months.
The bottom line here is that this is still supportive of market strength and not showing any sign yet of a slowing economy.
As always, we continue to monitor our long-term leading indicators for recession risk, as well as some of the near-term risks like escalating trade wars, accelerating inflation and Fed policy mistakes. However, we remain positive in our intermediate to longer-term outlook based on the core drivers that we still see in place today.
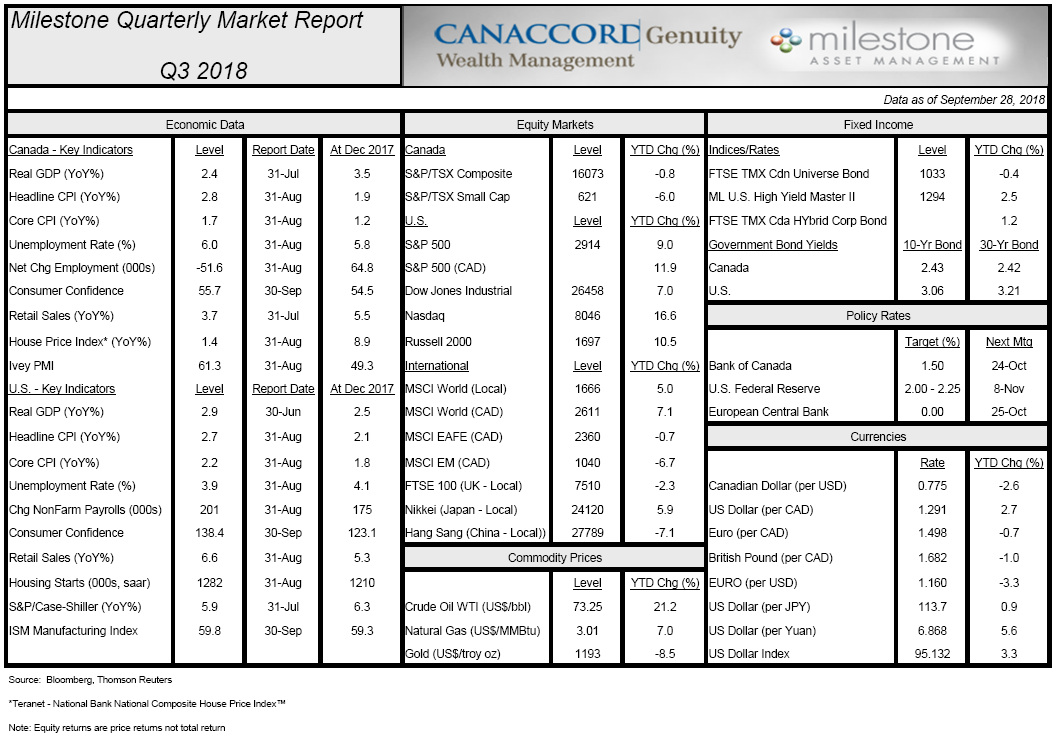
Here is our Milestone Market Report on economic data, capital markets, commodities and currencies through September 28th, 2018: (click image for PDF version)