Market Insights: As April to July goes, so goes the rest of the year?
Milestone Wealth Management Ltd. - Jul 26, 2018
As April to July Goes, so Goes the Rest of the Year? There is an old Wall Street adage, "As January goes, so goes the year", also known as the 'January Barometer'. Indeed, there has been a very strong correlation between positive January S&P 500 perf
As April to July Goes, so Goes the Rest of the Year?
There is an old Wall Street adage, "As January goes, so goes the year", also known as the 'January Barometer'. Indeed, there has been a very strong correlation between positive January S&P 500 performance and positive market performance for the entire year. We won't go through all the numbers here, but the reason for this connection could simply be the historical proclivity of stocks to rise. The US stock market has finished higher in all but 16 of the last 72 years since 1945 overall. The January Barometer doesn't always hold either, as we saw in 2016, where the S&P 500 returned 12% after falling 5% in January; in fact, the first ten trading days of 2016 were the worst on record. Same thing in 2014, January declined 3.5% only to end the year with a 13.5% return. The barometer has been a better positive indicator than a negative one.
This year, January was a fantastic start for the S&P 500, returning 5.6%, the 11th strongest since 1945. What is perhaps more indicative is that when January has returned over 5%, the 'January Barometer' has been an even more powerful indicator with the market returning an average of 22% and up 85% of the time in the 13 prior instances, which is much stronger than other up January years. However, after a strong January, the market this year had a very sharp decline over the following three months, with March's close over six percent lower than January, and at one point the market was down over 10% in February. So after the first quarter, you would be forgiven thinking this 'January Barometer' surely isn't going to work this year. In our past missives this year, we have focused on our positive fundamental thesis for markets, and so far this has played out with markets recovering in the second quarter.
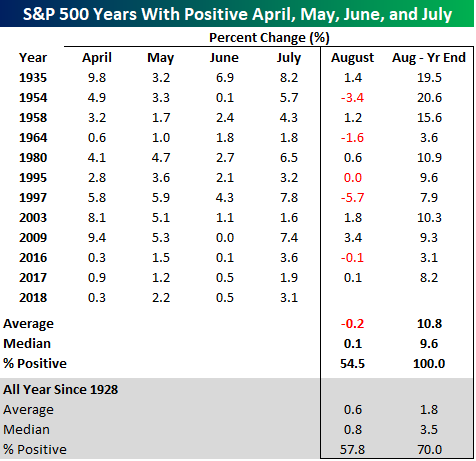
So what about recent performance, and why the title of this article? We will have seen the S&P 500 finish higher in each of the last four months (including July, barring an epic collapse). Is this is a normal occurrence? Not particularly. There have been just twelve occurrences going all the way back to 1928 but that includes each of the last three years. What has past data indicated for the rest of the year? As shown in the chart below, it shows that August could prove to be quite challenging, but that the August to year-end period has exhibited very strong performance. Over these instances, August has returned an average of -0.2% (0.1% median) and positive 55% of the time, but the August to year-end period has returned an average of 10.8% (9.6% median) and has been positive 100% of the time. This is vastly superior to all years, where the average return has been just 1.8% (3.5% median) and positive 70% of the time. In addition, if we look at mid-election years like we the one we are currently in, there have actually only been two other instances (1954 and 1958), and in those years the average return over the balance of the year has been 18.1%.
We shall call this the 'April to July Barometer' for our purposes. Do we put full faith into this indicator? Definitely not, but it surely gives us some added confidence to an otherwise positively biased fundamental backdrop to markets.