Market Insights: Bollinger Band Squeeze?
Milestone Wealth Management Ltd. - Nov 25, 2016
Right now, you are likely wondering, "What on earth is a Bollinger Band, and why do I care?" Occasionally, we endeavor to shed light on some interesting and lesser known (though not less important) phenomenon in our investment world, and this one...
Bollinger Band Squeeze?
Right now, you are likely wondering, "What on earth is a Bollinger Band, and why do I care?" Occasionally, we endeavor to shed light on some interesting and lesser known (though not less important) phenomenon in our investment world, and this one caught really our attention this week. We aim to keep these comments as concise and easy to understand as possible, so we will start with the conclusion, which is a positive one. If you wish to learn more about Bollinger Bands, you can read this description from StockCharts.com.
This technical chart pattern named in our title can either be a positive or negative signal of future prices (as with any signal, it is not correct 100% of the time), all depending on where market prices move once the 'squeeze' ends. In looking at U.S. equity markets, we have very recently seen a positive break of this pattern, but what seems to be potentially more enduring this time is that on a long-term monthly chart, the S&P 500's Bollinger Bands had compressed to levels that we have only seen two other times since the early 1980s (see chart below). The subsequent performance in the two previous times was very favourable and lasted for lengthy stretches of time (years). When we see patterns like this that are longer-term, it gives us more confidence in the signal.
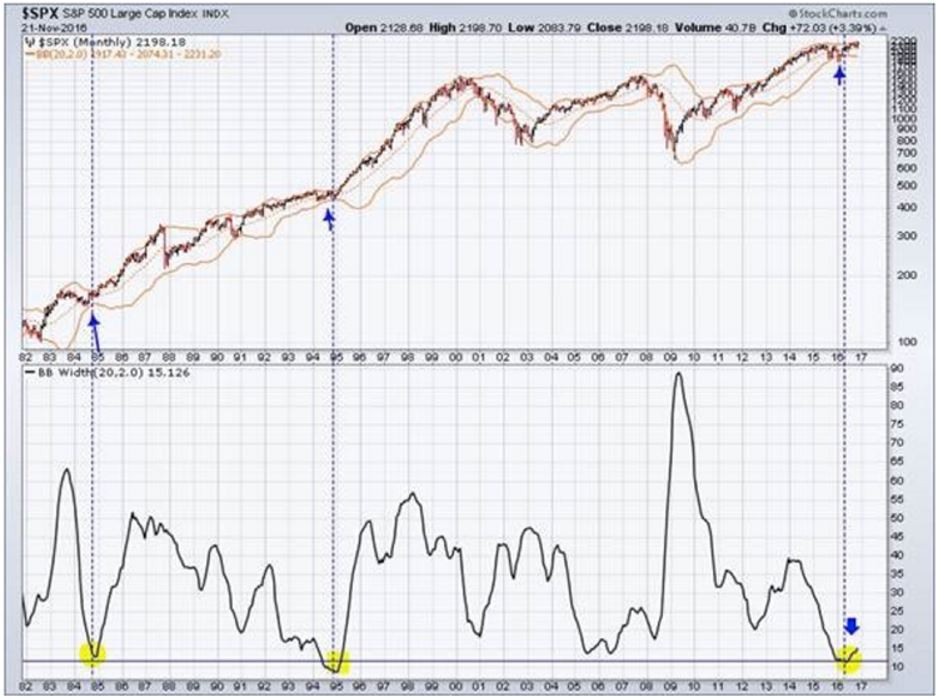
Source: StockCharts.com
What helps, perhaps, to back up this move is the Dow Theory buy signal we witnessed recently in the U.S. Dow Theory is the interrelationship between the well followed Dow Jones Industrial and the Dow Jones Transportation Averages. In registering this buy signal in July, the Dow Jones Industrial Average broke out of a 14-month consolidation period. This signal is not always right of course, but it is right far more often than not. From our long-term interpretation, it registered a sell signal in September of 1999, a buy signal in June of 2003, a sell signal in November of 2007 and numerous buy signals since the generational low in March of 2009. For all the uncertainty that seems to be ever present, and forcing us off course in the short-term, following relatively basic signals like this can most definitely help long-term investors stay focused on the long-term trend.