Market Insights: Equity seasonality & the Presidential Cycle
Milestone Wealth Management Ltd. - May 06, 2016
There has been no shortage of market commentaries or media chat about equity seasonality this week. This comes as no surprise, because what is viewed as the seasonally weak period for equities...
Equity seasonality & the Presidential Cycle
There has been no shortage of market commentaries or media chat about equity seasonality this week. This comes as no surprise, because what is viewed as the seasonally weak period for equities, May 6th to October 27th, begins today. In fact, some would propose that the amount of media coverage and the knowledge of the existence of this seasonally weak period by those in the investment community nowadays is one major factor driving its recurring presence. Does that mean one should head for the exit?
Empirically speaking, there is overwhelming evidence that equity markets do tend to perform better during the seasonally strong period from the end of October to early May; however, more often than not, the summer months can produce positive returns. What we do tend to see is some higher volatility, and we anticipate just the same this time around. Summer months tend to have lower volume, and this is likely one of the main reasons why volatility can be higher.
At Milestone, we do incorporate some seasonality adjustments to our portfolios; however, we use these in conjunction with many other indicators as well. Using one theme or indicator is usually not enough to assign appropriate probabilities to market outcomes and certainly not enough to make an informed decision. Take, for example, the May to October periods for 2013 and 2014. If you had not been invested in the equity markets during these periods you would have missed out on substantial returns.
What we find interesting is how this seasonality is affected by the U.S. Presidential Cycle. Do seasonally weak or strong periods, in general, change during the course of the four-year term? The evidence shows that there are definitely large variations, on average, depending on where you are in the Presidential cycle. Whether one can statistically ascertain whether or not there is a relationship there is not for this post to determine. We simply wish to illustrate that this current year is the last year of the Presidential Cycle, and it is generally this one final year in the cycle that does not seem to follow the typical seasonal pattern discussed above.
As you can see below, based on historical return data from the Dow Jones Industrial Average since 1900, during the last year of a Presidential Cycle, the typical seasonal pattern is reversed. Only time will tell if this pattern of reversal holds up, but after a difficult seasonally strong period for equities behind us, perhaps the stars are aligned for a "presidential reversal" to occur this year.
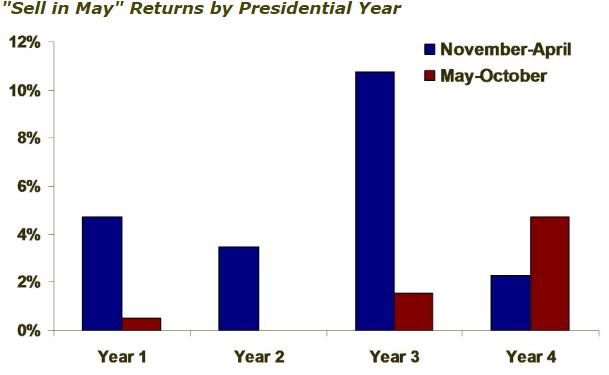
Source: J. Lyons Fund Management Inc. / My401kPro.com