Market Insights: What Are Energy Prices, AI IPOs and Market Breadth Telling Investors?
Milestone Wealth Management Ltd. - Jun 12, 2026
Macroeconomic and Market Developments:
- North American markets were up this week. In Canada, the S&P/TSX Composite Index rose by 1.52%, while in the U.S., the Dow Jones Industrial Average increased by 0.66% and the S&P 500 Index added 0.65%.
- The Canadian Dollar fell slightly this week, closing at 71.50 vs. 71.72 cents USD last week.
- Oil prices dropped substantially this week, with U.S. West Texas Crude closing at US$84.29 vs. US$90.38 last week.
- The price of Gold fell again this week closing at US$4,235 vs. US$4,337 last week, but it did recover strongly today up 3%.
- The Canadian dollar weakened further this week, reaching its lowest level in seven months against the U.S. dollar. The move was driven by softer domestic growth, wider Canada-U.S. interest rate spreads and shifting commodity dynamics. National Bank economists noted that the Loonie has recently moved more closely with gold than oil, with gold pulling back sharply from its highs. While they expect the currency could recover toward 74 cents U.S. by year-end, a sustained rebound may depend on stronger Canadian growth and a clearer trade outlook with the U.S.
- In Canada, the Bank of Canada held its policy rate steady at 2.25%, citing weak domestic activity, ongoing trade uncertainty and elevated energy prices tied to the conflict in the Middle East. First-quarter GDP edged down 0.1%, while employment has been relatively flat since the start of the year and unemployment remains in the 6.5% to 7.0% range. Inflation rose to 2.8% in April, largely due to higher energy prices. While the Bank appears willing to look through some of the near-term inflation pressure from energy, it remains focused on preventing those pressures from becoming more persistent.
- U.S. inflation data remained firm in May, with CPI rising 0.5% month-over-month and 4.2% from a year ago, while producer prices increased 1.1% in the month and 6.5% year-over-year. Energy was the main driver across both reports, with higher gasoline prices pushing up headline inflation even as core inflation was more contained. The data suggests underlying price pressures may not be as severe as the headline numbers imply, but higher energy costs and supply-chain pressures could limit the Federal Reserve’s flexibility on rate cuts in the near term.
- Investor appetite for high-growth technology listings was tested this week as SpaceX completed a record $75 billion IPO at a $1.77 trillion valuation, while OpenAI and Anthropic have also moved toward public listings. The wave of potential mega-IPOs highlights continued demand for exposure to artificial intelligence, space technology, and next-generation infrastructure. At the same time, these listings will test whether public markets are willing to support the lofty private-market valuations being placed on companies that still require significant capital investment and, in some cases, remain unprofitable. SpaceX opened up at an IPO price of $135 USD today and closed at $165.95 for a first day gain of 19.22%.
Weekly Diversion:
Check out this video: The Greatest Comeback in NBA Finals History
Charts of the Week
This week’s first chart points to improving participation beneath the surface of the market after the recent price correction. Market breadth has strengthened over the past week, with 318 stocks in the S&P 500 Index advancing in yesterday’s session and over 350 stocks two days prior even though the price index declined that day. This is constructive because it suggests the market’s recovery yesterday and today is not being driven solely by a small group of large-cap companies. The S&P 500 also remains above its 50-day and 200-day moving averages, key technical indicators which support the broader trend, even as short-term volatility remains possible.
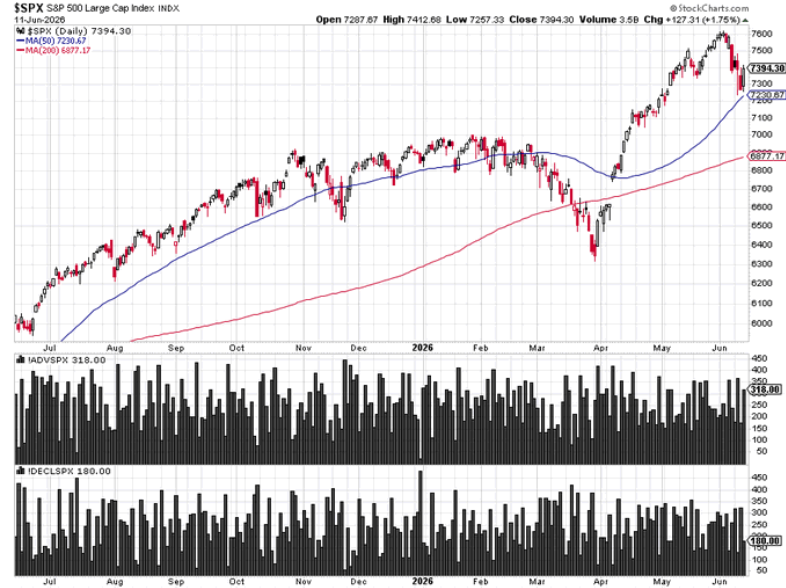
Sources: Ryan Detrick, StockCharts
The Materials sector is another area worth watching if market leadership continues to broaden. Materials were one of the strongest-performing sectors earlier in the year before Energy took the lead, but the sector has since spent several months consolidating in a tighter range. After such a strong start, this pause may be healthy. If momentum begins to rotate into more areas of the market, the Materials sector could become a notable opportunity within that broader participation trend.
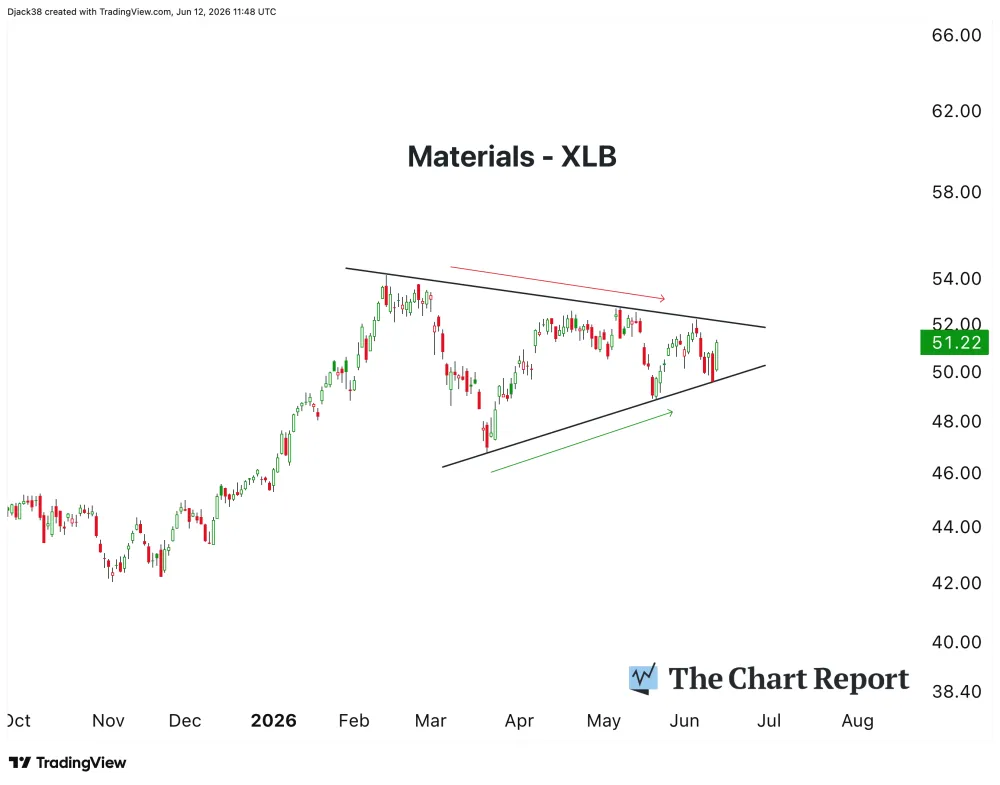
Source: The Chart Report, TradingView
Sources: Reuters, National Bank Financial, Bank of Canada, First Trust Data Watch, Bureau of Labor Statistics, @Ryan Detrick, StockCharts, The Chart Report, TradingView
©2026 Milestone Wealth Management Ltd. All rights reserved.
DISCLAIMER: Investing in equities is not guaranteed, values change frequently, and past results are not necessarily an indicator of future performance. Investors cannot invest directly in an index. Index returns do not reflect any fees, expenses, or sales charges. Opinions and estimates are written as of the date of this report and may change without notice. Any commentaries, reports or other content are provided for your information only and are not considered investment advice. Readers should not act on this information without first consulting Milestone, their investment advisor, tax advisor, financial planner, or lawyer. This communication is intended for Canadian residents only and does not constitute as an offer or solicitation by anyone in any jurisdiction in which such an offer is not allowed.