Market Insights: Is the Next Opportunity in Private Equity Markets?
Milestone Wealth Management Ltd. - Jun 05, 2026
Macroeconomic and Market Developments:
- North American markets were down this week. In Canada, the S&P/TSX Composite Index fell by 1.02%, while in the U.S., the Dow Jones Industrial Average decreased by 0.32% and the S&P 500 Index dropped by 2.59%.
- The Canadian Dollar lowered this week, closing at 71.72 vs. 72.46 cents USD last week.
- Oil prices increased this week, with U.S. West Texas Crude closing at US$90.38 vs. US$88.12 last week.
- The price of Gold declined this week closing at US$4,337 vs. US$4,577 last week.
- Canada’s economy remains under pressure after real GDP contracted for a second straight quarter, meeting the common definition of a technical recession. However, economists have cautioned against reading too much into the label, as the broader picture remains mixed and early estimates point to some rebound in activity. The weakness still matters, especially for business investment and trade-sensitive sectors, but the data suggests Canada’s slowdown is more nuanced than a typical recession signal.
- U.S. services activity strengthened in May, with the ISM Non-Manufacturing Index, a key measure of U.S. services sector activity, rising to 54.5. A reading above 50 signals expansion, meaning the sector continued to grow and came in ahead of expectations for its 23rd straight month in expansion territory. The improvement was led by stronger business activity and new orders, suggesting the service side of the economy remains resilient despite broader uncertainty. However, employment remained in contraction and prices paid rose to the highest level since August 2022, pointing to a mix of steady demand, cautious hiring, and persistent inflation pressure.
- Canada will extend its steel tariff-rate quotas and tariff relief on certain U.S. steel and aluminum imports by one year, giving domestic producers more certainty while protecting workers from global excess capacity. The measures, pending cabinet approval, would run until June 2027, with imports above quota limits still facing a 50% tariff. Separately, newly proposed U.S. tariffs are expected to have limited direct impact on Canada because most CUSMA-compliant exports would remain exempt. While this lowers near-term trade risk, ongoing tariff uncertainty remains a headwind for business investment, exports, and confidence.
- Shopify (SHOP) announced a US$3 billion increase to its ongoing share repurchase program, bringing its total buyback authorization to US$5 billion. As of June 1, the Ottawa-based e-commerce company had already repurchased about US$1.45 billion under the current authorization, with no set quarterly or annual minimums going forward. Management said the move reflects confidence in the durability of the business, while also giving Shopify flexibility to return capital to shareholders over time. As one of Canada’s largest publicly traded technology companies, the announcement is a constructive signal for the Canadian tech sector and highlights Shopify’s continued financial strength.
- SpaceX (SPCX) is reportedly preparing for a record-setting IPO that could raise up to US$75 billion and value the company at roughly US$1.77 trillion. If completed, the offering would surpass Saudi Aramco’s 2019 IPO and rank SpaceX among the most valuable companies in the world. The potential listing comes as investor appetite for AI, space infrastructure, and next-generation technology remains strong, even though SpaceX continues to post operating losses. For markets, the deal could become a major test of public investor demand after a quieter IPO period and may help set the tone for other expected AI-related listings, including Anthropic and potentially OpenAI.
Weekly Diversion:
Check out this video: Always Yell "Fore!"
Charts of the Week
This week’s charts look at the relative value of private equity markets as well the current strength beneath the surface of today’s public stock markets. Public equities have delivered unusually strong recent returns, technology continues to lead, and broader market participation is starting to improve. Together, the charts show a market that still has impressive momentum, but also one where valuations, concentration, and return expectations deserve attention.
The first chart shows a major difference between public and private markets today. The S&P 500’s current rolling three-year return is 24.9%, placing it in the 99th percentile of historical three-year periods. Private equity, by comparison, has a current rolling three-year return of 5.5%, placing it in the 26th percentile of its historical range. This does not guarantee private equity will outperform from here, but it suggests private markets may be earlier in their return cycle, while public equity returns already look much more stretched. For long-term investors who are more comfortable with less liquidity, this market may be a more attractive setup.
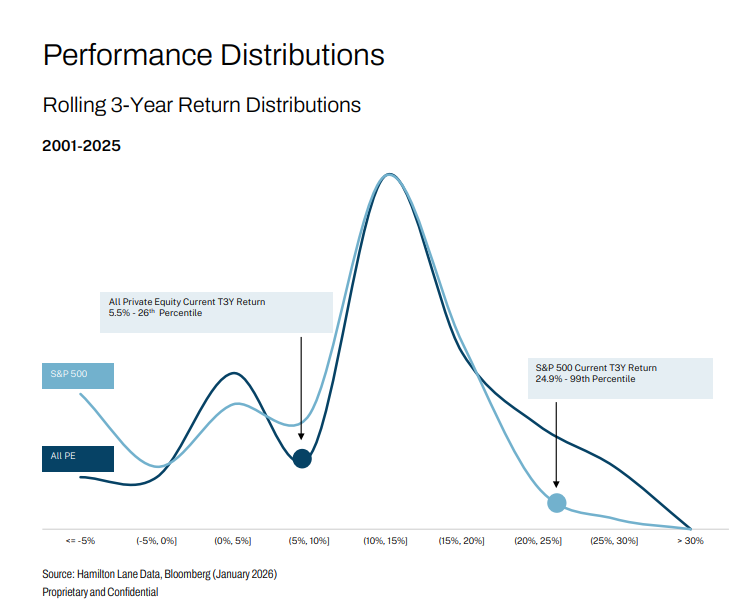
Source: Hamilton Lane Data, Bloomberg (January 2026)
The next chart illustrates the Nasdaq Composite (tech sector) relative to the S&P 500 Index testing the same relative highs reached during the Dotcom Bubble in 2000. This highlights how dominant technology and growth stocks have become, supported by AI optimism, strong earnings, and continued investor demand for large-cap tech exposure. The comparison to 2000 is important, but the backdrop today is different, as many leading technology companies are highly profitable and cash generative. Still, the chart is a reminder that market leadership remains
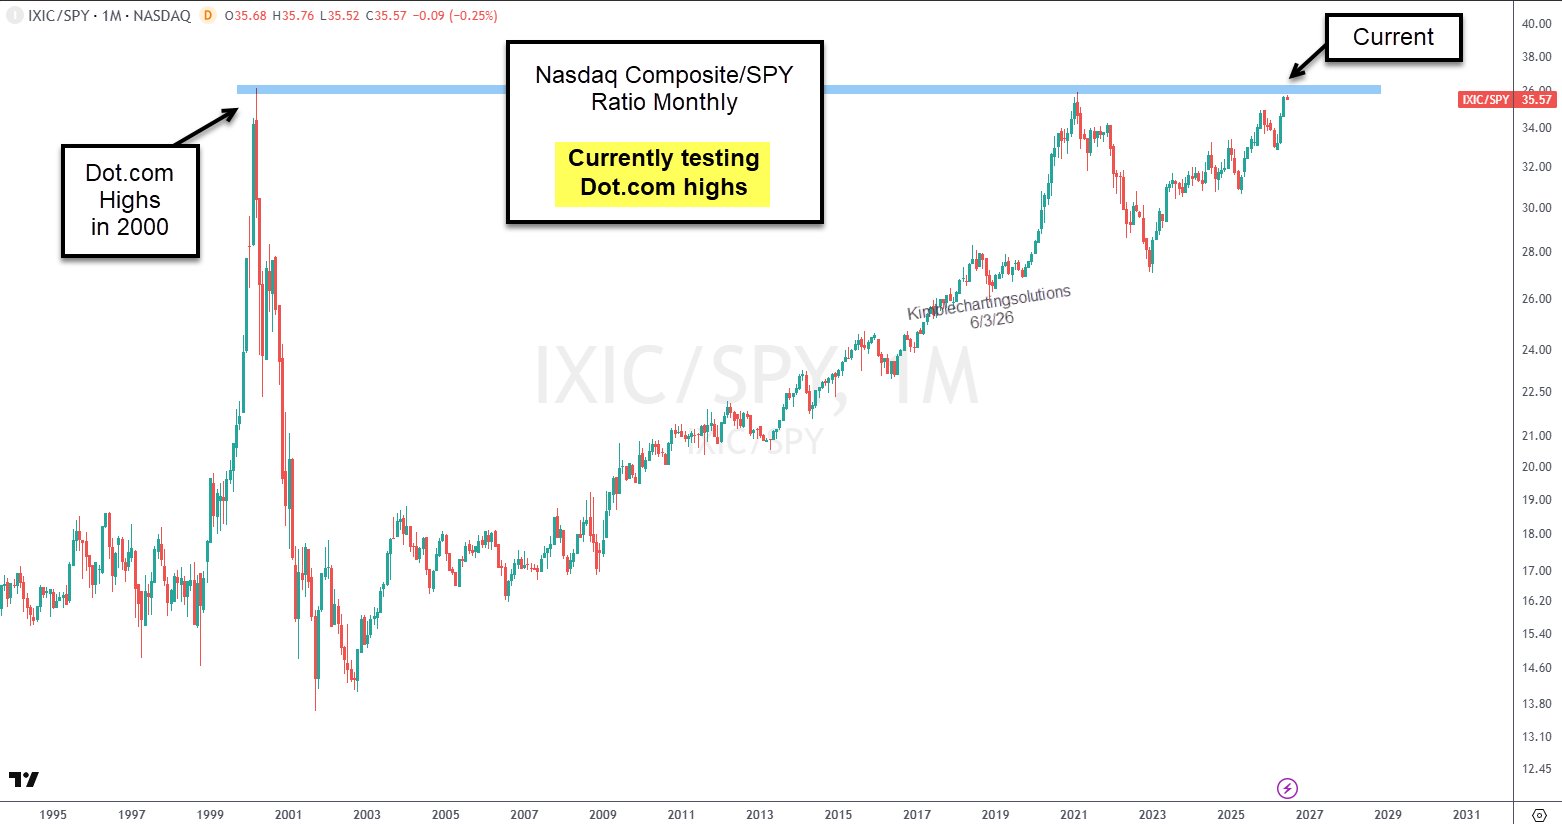
Source: Chris Kimble @KimbleCharting, The Chart Report
Finally, the last chart has the NYSE Composite breaking out to new all-time highs, which is a positive signal for overall market participation. Unlike narrower indices, the NYSE Composite tracks more than 2,000 common stocks, so new highs suggest the rally has been broadening beyond mega-cap technology. After such a strong move, some near-term consolidation would be normal, but the broader message remains constructive; for now, this bull market continues to show strength on and beneath the surface.
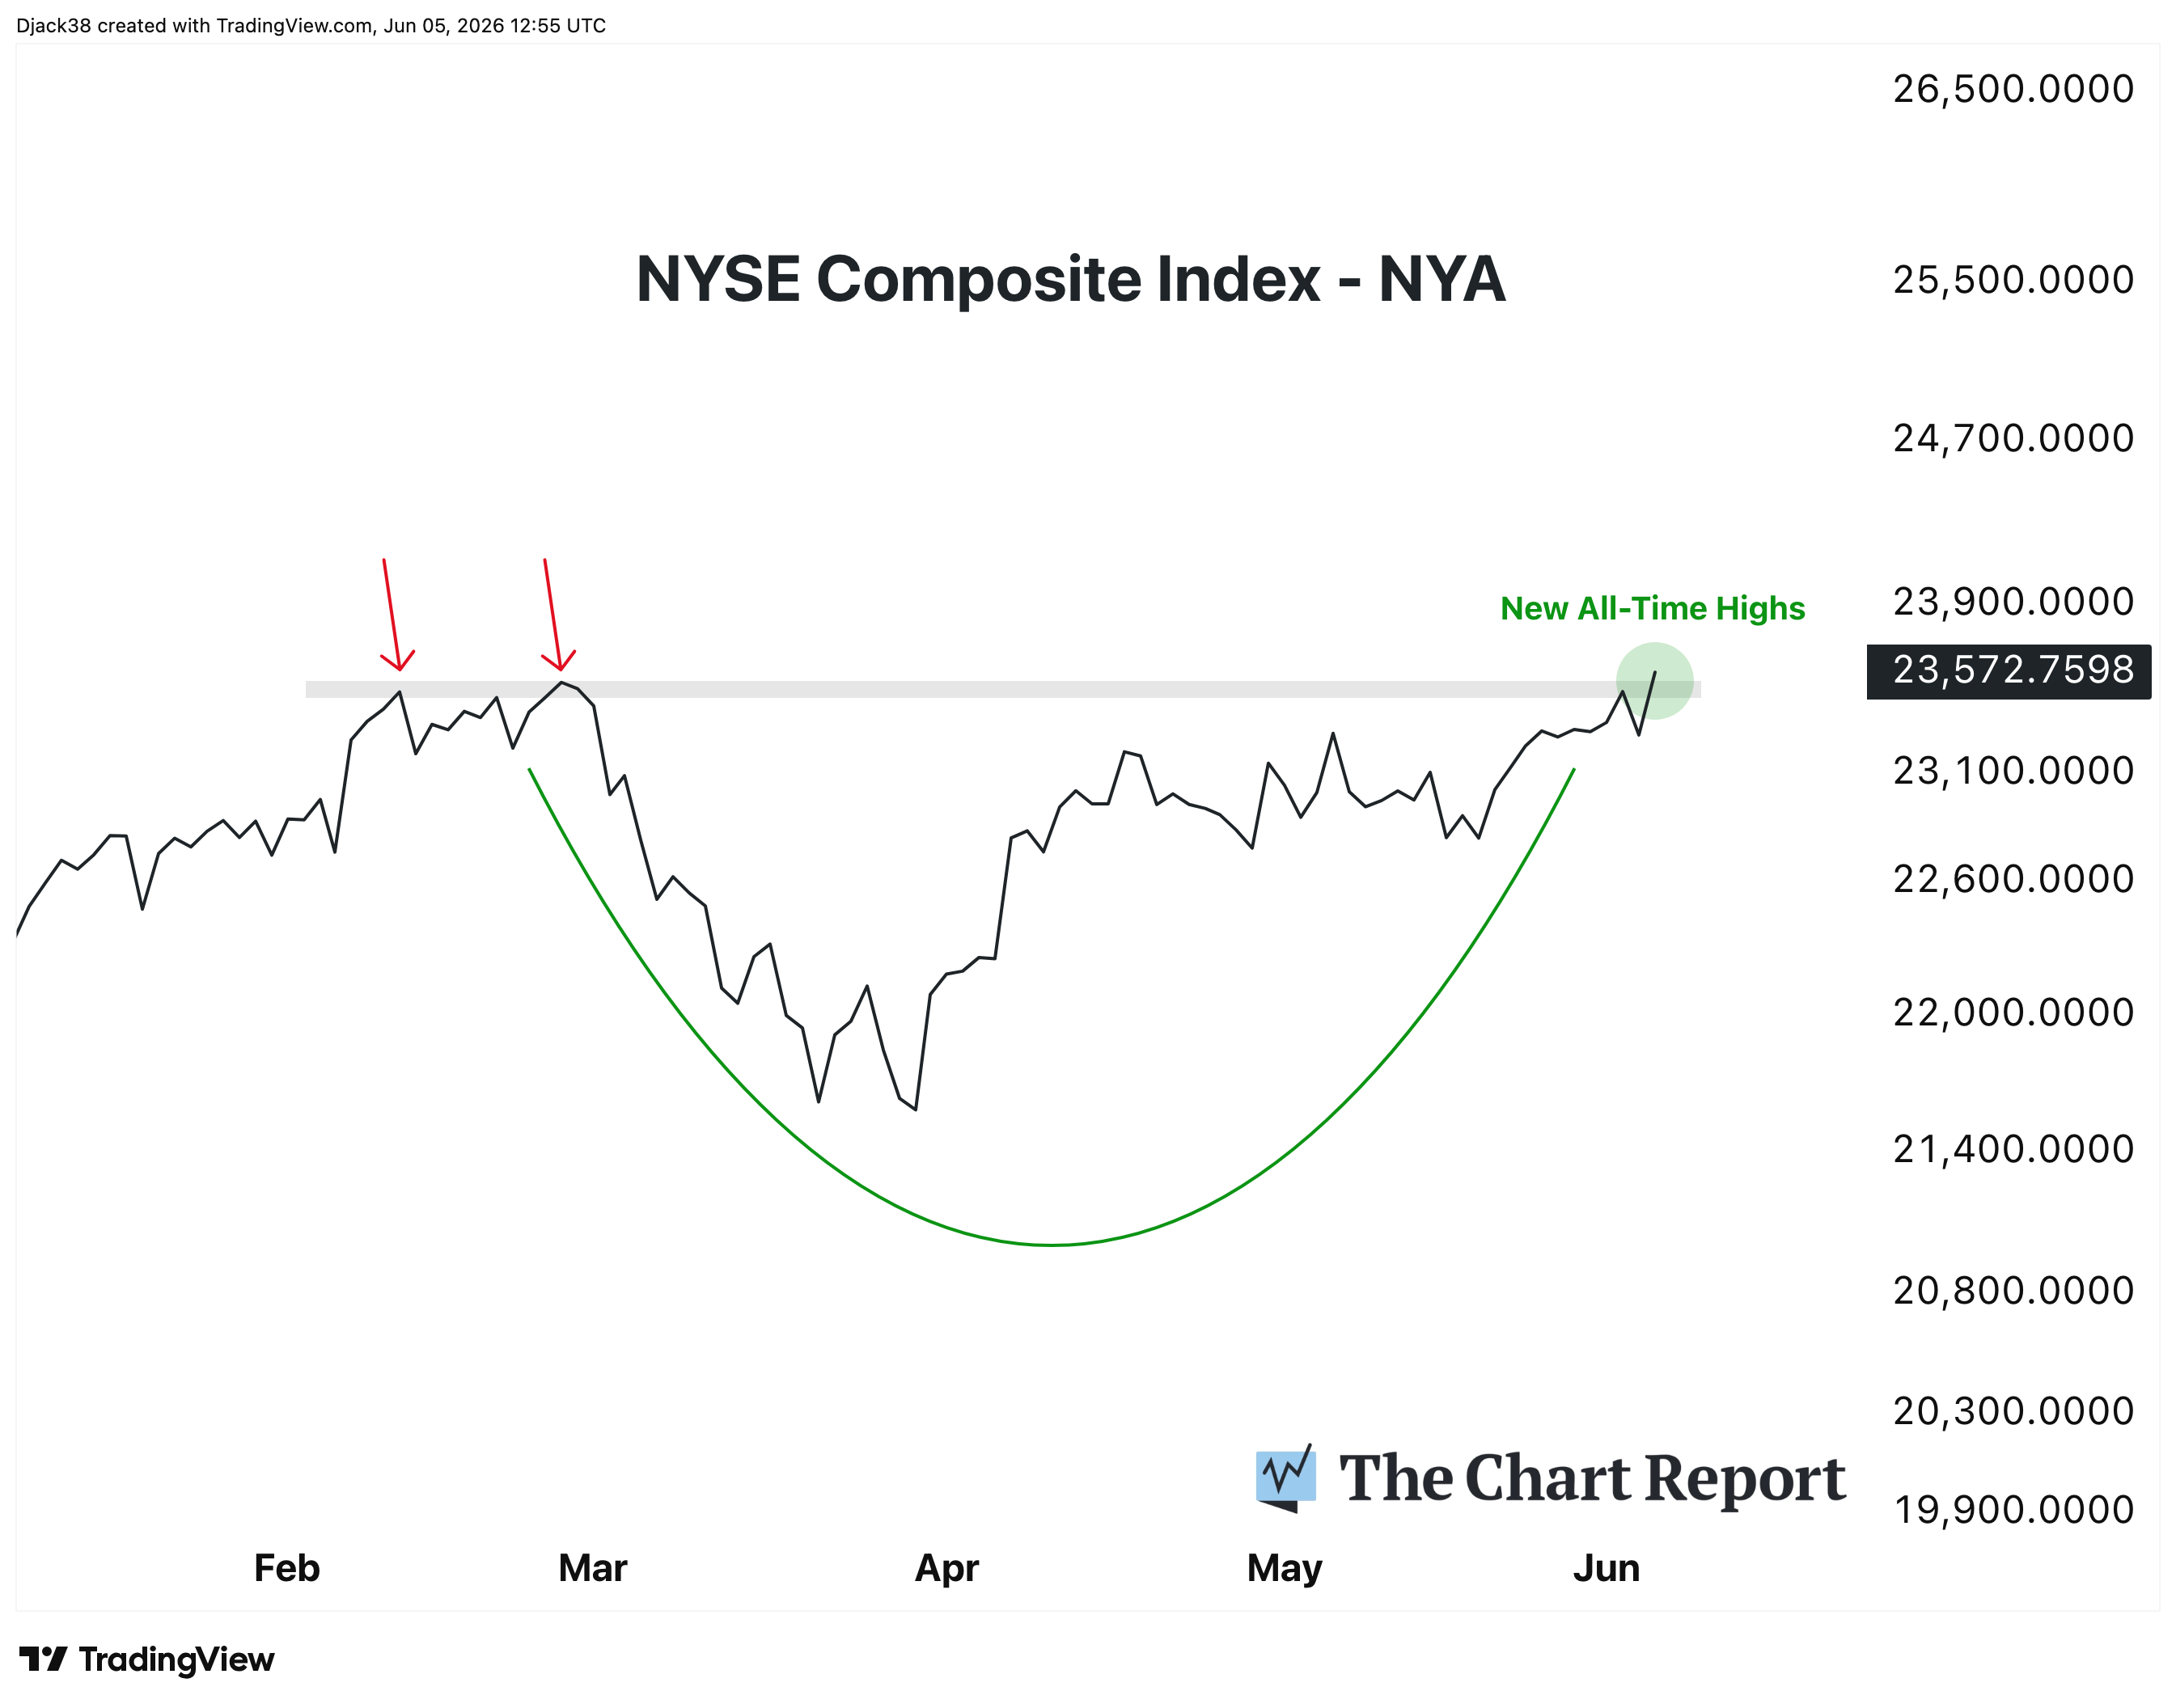
Source: The Chart Report
Sources: Yahoo Finance, Chris Kimble @KimbleCharting, The Chart Report, Hamilton Lane Data, Bloomberg (January 2026), Reuters, Canadian press, Government of Canada, Canada.ca, First
©2026 Milestone Wealth Management Ltd. All rights reserved.
DISCLAIMER: Investing in equities is not guaranteed, values change frequently, and past results are not necessarily an indicator of future performance. Investors cannot invest directly in an index. Index returns do not reflect any fees, expenses, or sales charges. Opinions and estimates are written as of the date of this report and may change without notice. Any commentaries, reports or other content are provided for your information only and are not considered investment advice. Readers should not act on this information without first consulting Milestone, their investment advisor, tax advisor, financial planner, or lawyer. This communication is intended for Canadian residents only and does not constitute as an offer or solicitation by anyone in any jurisdiction in which such an offer is not allowed.