Market Insights: Market Leadership Looks Different This Time
Milestone Wealth Management Ltd. - May 29, 2026
Macroeconomic and Market Developments:
- North American markets were up this week. In Canada, the S&P/TSX Composite Index closed 0.83% higher, while in the U.S., the Dow Jones Industrial Average increased by 1.49% and the S&P 500 Index rose 1.80%.
- The Canadian Dollar rose slightly this week, closing at 72.46 vs. 72.35 cents USD last week.
- Oil prices lowered this week, with U.S. West Texas Crude closing at US$88.12 vs. US$96.30 last week.
- The price of Gold increased this week closing at US$4,577 vs. US$4,508 last week.
- Canada’s economy showed further signs of weakness in the first quarter, with real GDP essentially flat and down 0.1% on an annualized basis after a 1.0% decline in the fourth quarter. While two straight quarterly declines meet some definitions of a technical recession, economists were divided on the label, noting that the broader picture is more mixed. Weak business investment, housing activity, resources, and construction weighed on growth, though early April estimates point to a rebound led by mining, oil, and gas. The soft data also reduces pressure on the Bank of Canada to consider higher rates.
- U.S. first-quarter GDP was revised lower to 1.6% annualized growth, mainly due to softer inventories and consumer spending. Underlying “core” GDP remained firmer at 2.4%, supported by consumer spending, business investment, and homebuilding. Corporate profits were a bright spot, rising 12% from a year ago, while inflation remained above the Fed’s target, with GDP prices up 3.5%. Overall, the report points to slower headline growth, resilient underlying demand, and limited room for near-term rate cuts.
- Scotiabank’s latest earnings offered a constructive signal for the Canadian economy, with adjusted profit up 28% year over year and results beating expectations. Management pointed to improving investor sentiment, a more business-friendly policy backdrop, and renewed interest in Canadian energy and infrastructure projects. While credit provisions remain elevated, the bank still expects losses to trend lower in the second half of the year, suggesting resilience despite a cautious economic outlook.
- Northern Oil & Gas is making its first international move with a C$350 million investment for a 25% stake in Alberta’s Duvernay shale basin. The deal reflects renewed foreign interest in Canadian energy assets, supported by improved pipeline access, a more pro-development policy backdrop, and growing investor confidence in Canadian resource development. Northern’s CEO said the company has a strong belief in Canada and sees the investment potentially growing into a multibillion-dollar opportunity.
- Vancouver’s Oakridge Park opened to large crowds this week, offering a positive signal from the high-end consumer and real estate market. The $6.5 billion mixed-use development features luxury brands including Louis Vuitton, Prada, Miu Miu, Rolex, Versace, Valentino, Dolce & Gabbana, and Bvlgari, alongside residential and office space. While broader affordability pressures remain, the opening suggests demand for premium retail and urban mixed-use development remains resilient in select Canadian markets.
Weekly Diversion:
Check out this video: Pizza Hut Goes Back to the Future
Charts of the Week
Technology leadership and market momentum continue to define the current environment. While tech’s growing share of the S&P 500 Index has brought back comparisons to the Dotcom Bubble, the earnings backdrop looks meaningfully stronger today. At the same time, the broader market has continued to show strong momentum, with history suggesting that powerful rallies can often continue longer than investors expect.
The S&P Information Technology Sector now represents 37% of the S&P 500’s total market capitalization, surpassing the previous peak of roughly 35% reached during the Dotcom Bubble in 2000. This level of concentration is notable, but the comparison is not perfect. At the height of the Dotcom era, technology represented only 13% of S&P 500 earnings. Today, that figure is closer to 26%, suggesting that the sector’s leadership is supported by a stronger earnings base than it was in 2000.
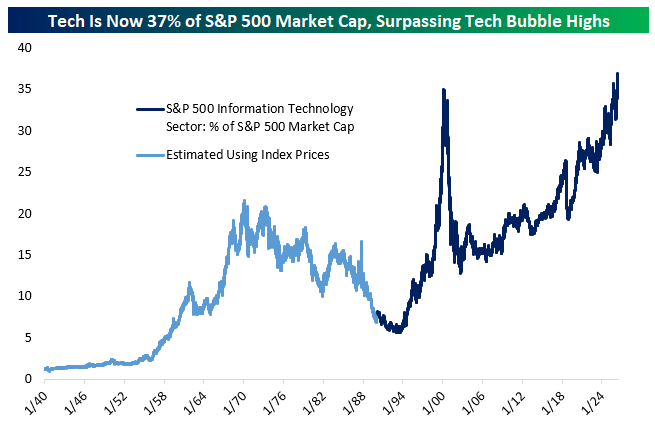
Source: Bespoke
The recent increase in this sector’s market share has been driven primarily by the semiconductors industry group. Unlike the Dotcom period, when broad enthusiasm for internet and hardware-related companies pushed the sector higher, today’s leadership is more directly tied to AI infrastructure demand. Software’s share of the market remains near its lowest level since 2009, which highlights how concentrated the current rally has become in semiconductor-related companies.
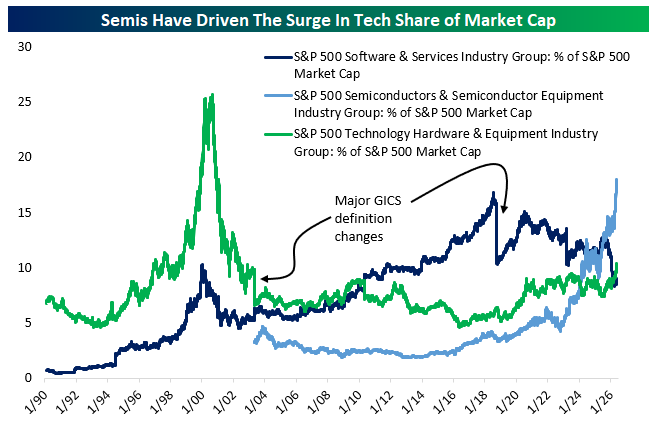
Source: Bespoke
The S&P 500’s recent weekly winning streak also points to strong market momentum. If the index finishes higher this week, it will mark nine consecutive weekly gains, a rare stretch that has only occurred a limited number of times since 1945. Historically, these streaks have not typically appeared immediately before major market tops. Instead, they have often occurred during broader advances, suggesting strong momentum can persist even after an extended run.
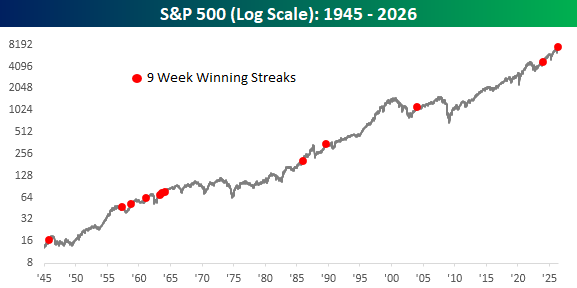
Source: Bespoke
Strong spring returns for the S&P 500 have also tended to be a constructive signal. When the S&P 500 has gained more than 10% across April and May, June has been positive in every prior instance, with an average return of 3.9%. The rest of the year has also been positive each time, averaging 18.6%. While history does not guarantee the same outcome, the small sample data suggests that sharp spring rallies have been followed by continued strength rather than an immediate reversal.
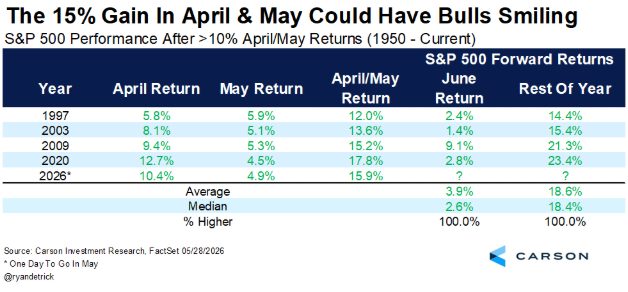
Source: Carson Investment Research, Fact Sheet, @ryandetrick
Sources: Yahoo Finance, Bespoke, The Canadian Press, BNN Bloomberg, Carson Investment Research, Fact Sheet, @ryandetrick, Vancouver City News, Energy Now, First Trust, Data Watch
©2026 Milestone Wealth Management Ltd. All rights reserved.
DISCLAIMER: Investing in equities is not guaranteed, values change frequently, and past results are not necessarily an indicator of future performance. Investors cannot invest directly in an index. Index returns do not reflect any fees, expenses, or sales charges. Opinions and estimates are written as of the date of this report and may change without notice. Any commentaries, reports or other content are provided for your information only and are not considered investment advice. Readers should not act on this information without first consulting Milestone, their investment advisor, tax advisor, financial planner, or lawyer. This communication is intended for Canadian residents only and does not constitute as an offer or solicitation by anyone in any jurisdiction in which such an offer is not allowed.