Market Insights: History Has a Pattern and It Favors the Patient
Milestone Wealth Management Ltd. - May 22, 2026
Macroeconomic and Market Developments:
- North American markets were up this week. In Canada, the S&P/TSX Composite Index closed 0.59% higher, while in the U.S., the Dow Jones Industrial Average increased by 2.13% and the S&P 500 Index rose 0.88%.
- The Canadian Dollar fell this week, closing at 72.35 vs. 72.64 cents USD last week.
- Oil prices lowered this week, with U.S. West Texas Crude closing at US$96.30 vs. US$101.30 last week.
- The price of Gold fell this week closing at US$4,508 vs. US$4,555 last week.
- CPP Investments posted a net return of 7.8% for the fiscal year ended March 2026, growing the fund to $793.3 billion, driven largely by U.S. public equities. CEO John Graham flagged the federal government's newly announced $25-billion sovereign wealth fund and potential privatization of assets like airports as interesting opportunities for institutional investors, though he noted the devil is in the details.
- SpaceX filed for what could become one of the largest initial public offerings in history, with reports suggesting the company could raise roughly $75 billion at a valuation approaching $2 trillion. The filing adds to growing investor focus on a potential wave of mega-IPOs, particularly in technology and AI-related businesses, which could create meaningful new equity supply for public markets later this year.
- U.S. long-term bond yields moved higher this week, with the 30-year Treasury yield reaching its highest level since 2007. The move reflects ongoing inflation concerns, elevated energy prices, and worries about government finances, and could put pressure on borrowing costs and equity valuations if yields remain elevated.
- Jason Nixon was named Alberta's new Finance Minister Thursday as Premier Danielle Smith reshuffled her cabinet, replacing Nate Horner who announced his resignation earlier this week. Nixon, a veteran legislator with prior experience in finance under former Premier Jason Kenney, inherits a challenging portfolio facing a projected $9.4-billion deficit and oil price volatility driven by the ongoing U.S.-Israel conflict with Iran.
- The UAE is fast-tracking a second oil pipeline designed to bypass the Strait of Hormuz, as conflict involving Iran continues to highlight the vulnerability of one of the world’s most important energy chokepoints. The project would give Gulf producers another export route and could improve long-term energy security, though near-term oil markets remain sensitive to any disruption in the region.
Weekly Diversion:
Check out this video: Don't Mess With This Beluga!
Charts of the Week
Markets have continued to push higher, driven in large part by the ongoing artificial intelligence boom. This week's charts explore the long-term case for staying invested through innovation cycles, the current momentum picture for both Nvidia and the broader market, and what history suggests about what may come next.
The first chart puts today's market in a century of context. Since the 1920s, the S&P 500 has experienced repeating cycles of technology-driven expansion lasting roughly 24 to 25 years, each delivering gains above 2,500%, followed by consolidation periods averaging about 9 years. The current cycle, built on smartphones, e-commerce, and now artificial intelligence, is approximately 16 years in. If history is any guide, there may be more runway ahead than many investors assume. The biggest mistake investors can make is underestimating how long a powerful trend can last.
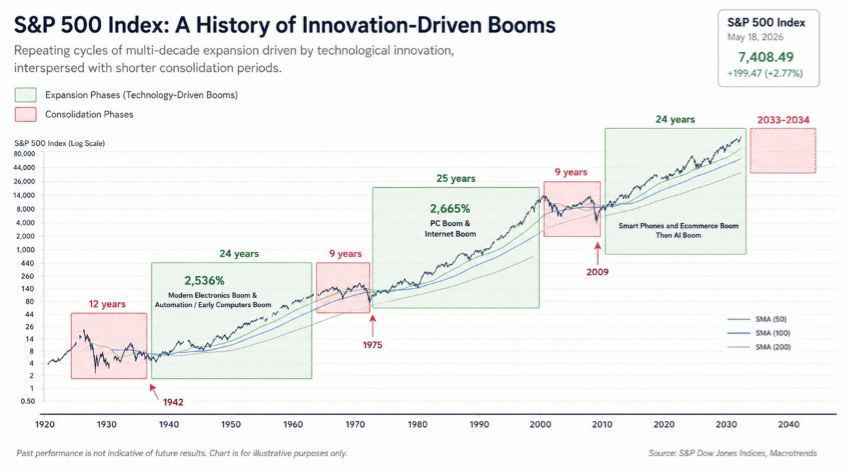 Source: Rand Group, S&P Dow Jones, Macrotrends
You may have heard the saying, "as goes Nvidia, so goes the market." Over the last two years, that has largely held true. The second chart shows that while the magnitude of Nvidia's moves has been far greater than the broader index, the patterns of the two have been remarkably similar, rising and falling in close step with one another.
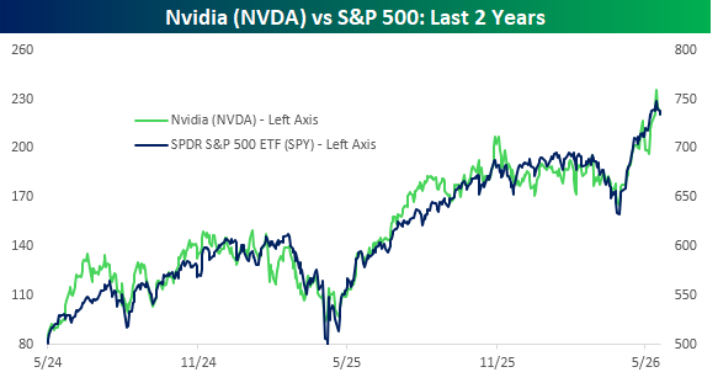
Source: Bespoke
The next chart puts Nvidia's relative strength in a longer-term context. Since the launch of ChatGPT in late 2022, Nvidia's outperformance versus the S&P 500 has followed a steady upward trend, marked by sharp bursts of outperformance followed by periods of consolidation. After trading roughly in line with the market for nearly a year, the stock appears to be attempting a new leg higher.
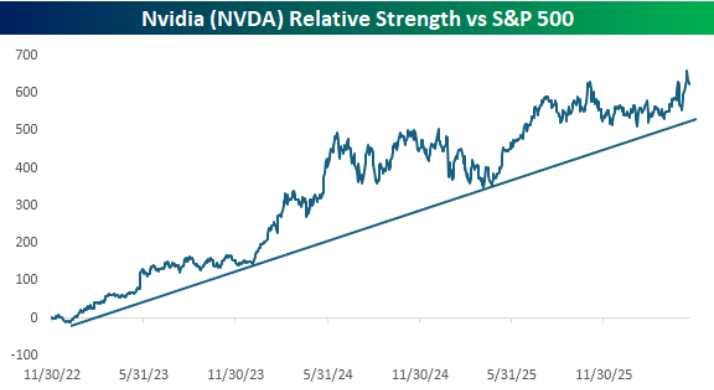
Source: Bespoke
The final chart highlights how household wealth has become increasingly tied to the stock market. U.S. household mutual fund and corporate equity assets are now meaningfully above household real estate assets, reaching levels only seen around a few major periods in the past, including the late 1990s tech bubble and the 2021 market peak.
While this does not mean a pullback is imminent, it does suggest households are potentially more exposed to equity market volatility than usual. Historically, similar periods have often been followed by some form of rebalancing, either through stock market consolidation, real estate catching up, or a shift in household asset allocation.
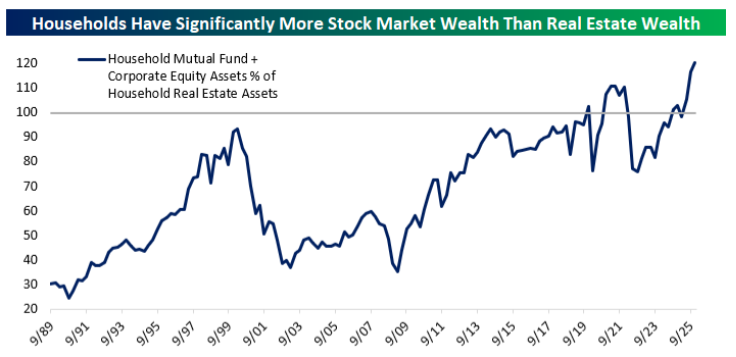
Source: Bespoke
Sources: Yahoo Finance, Financial Post, Reuters, Bloomberg, Paul Kedrosky, CNBC, Rand Group, Bespoke, S&P Dow Jones, Macrotrends
©2026 Milestone Wealth Management Ltd. All rights reserved.
DISCLAIMER: Investing in equities is not guaranteed, values change frequently, and past results are not necessarily an indicator of future performance. Investors cannot invest directly in an index. Index returns do not reflect any fees, expenses, or sales charges. Opinions and estimates are written as of the date of this report and may change without notice. Any commentaries, reports or other content are provided for your information only and are not considered investment advice. Readers should not act on this information without first consulting Milestone, their investment advisor, tax advisor, financial planner, or lawyer. This communication is intended for Canadian residents only and does not constitute as an offer or solicitation by anyone in any jurisdiction in which such an offer is not allowed.