Market Insights: Why Seasonals Still Bow to Momentum
Milestone Wealth Management Ltd. - May 01, 2026
Macroeconomic and Market Developments:
- North American markets were mostly up this week. In Canada, the S&P/TSX Composite Index closed 0.04% lower, while in the U.S., the Dow Jones Industrial Average increased by 0.55% and the S&P 500 Index advanced 0.91%.
- The Canadian Dollar rose slightly this week, closing at 73.54 vs. 73.18 cents USD last week.
- Oil prices also rose this week, with U.S. West Texas Crude closing at US$102.11 vs. US$94.75 last week.
- The price of Gold fell again this week closing at US$4,621 vs. US$4,730 last week.
- U.S. real GDP grew at a 2.0% annualized rate in Q1 (below 2.3% expected), reflecting a moderate but not recessionary pace, with strength driven by a 10.4% surge in business investment—largely tied to AI spending—and steady consumer demand (+1.6%), while net exports (-1.3pp) and construction weighed on growth; economists Brian S. Wesbury and Robert Stein note that underlying “core” growth remained stable at 2.5%, but elevated inflation (GDP price index +3.6%) and energy-related pressures suggest the Federal Reserve is unlikely to cut rates in the near term, reinforcing a backdrop of steady but unspectacular growth with persistent inflation concerns.
- President Donald Trump announced plans to raise tariffs on EU-made cars and trucks to 25%, citing concerns that the European Union has not fully complied with existing trade agreements, while maintaining exemptions for vehicles produced in U.S. factories—encouraging domestic manufacturing investment; the move reverses a prior 15% tariff cap and reflects heightened trade tensions between the U.S. and EU, with potential implications for global auto supply chains, pricing, and cross-border investment.
- President Donald Trump approved a major new Canada-U.S. oil project—the Bridger Pipeline Expansion, often dubbed “Keystone Light”—which would transport up to 550,000 barrels per day from Canada into the U.S., reinforcing a more pro-energy infrastructure stance and supporting cross-border crude flows; while the project still requires additional environmental approvals and faces opposition over spill risks, it highlights renewed momentum for North American energy integration and export capacity, particularly as policymakers balance energy security, economic growth, and environmental concerns.
- The OPEC faces a significant shift as the United Arab Emirates announced its exit from the cartel, citing a desire to pursue independent production strategy after years of frustration with output caps, marking a potential weakening of coordinated supply control; while near-term market impact is limited due to ongoing disruptions in the Strait of Hormuz, the move signals longer-term risks to OPEC’s influence, as the UAE looks to increase production capacity (targeting ~5M bpd) and potentially add ~1.6M bpd of incremental supply, reinforcing evolving dynamics in global energy markets as producers position for both geopolitical uncertainty and a shifting long-term demand outlook.
- TC Energy announced a US$1.5B expansion of its Columbia Gas system in the U.S. through the Appalachia Supply Project, aimed at boosting natural gas capacity across key regions from New York to the Southeast by 2030, as the company reported Q1 net income of $899M (down y/y) but higher comparable earnings (99¢/share) and revenue growth to $3.86B; the project reflects ongoing investment in U.S. gas infrastructure to meet rising demand, even as earnings face near-term pressure.
Weekly Diversion:
Check out this video: I said a hip-hop, the hippie, the hippie to the hip, hip-hop and you don’t stop rockin’
Charts of the Week:
While the May–October window has indeed been a relatively soft seasonal stretch over many decades, the data shows that returns have still been positive more often than not, especially when the year is already off to a strong start.
The first chart below, which ranks six month stretches of index performance by calendar period, shows that the May–October window has indeed historically been the weakest on average, with returns around the low single digits and a positive success rate of roughly two thirds of the time. Even there, however, the bar remains above zero, underlining that “worst” in this context still means typically positive, not negative. This distinction matters because it reframes the seasonal effect from a high conviction sell signal into a modest headwind that must be weighed against other forces.
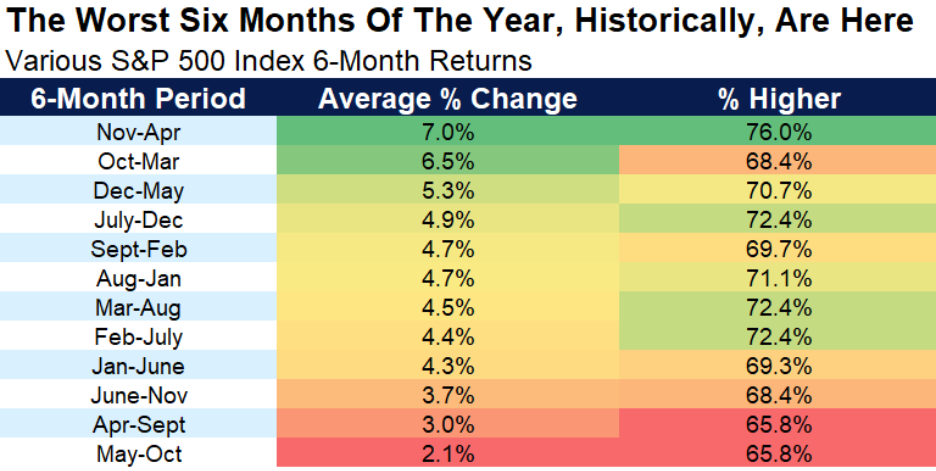 Source: Carson Group, FactSet, @ryandetrick
The next chart zooms in on the most recent decade and paints a very different picture from the long‑term averages. As we can see, the returns for the May to October “Sell in May” periods have been positive nine out of the last ten times, with average returns at 6.9%. For a supposedly difficult stretch, these success rates are more consistent with bull market seasonality than with a period to avoid, highlighting how structural shifts, policy regimes, or simply noise can overwhelm calendar proverbs.
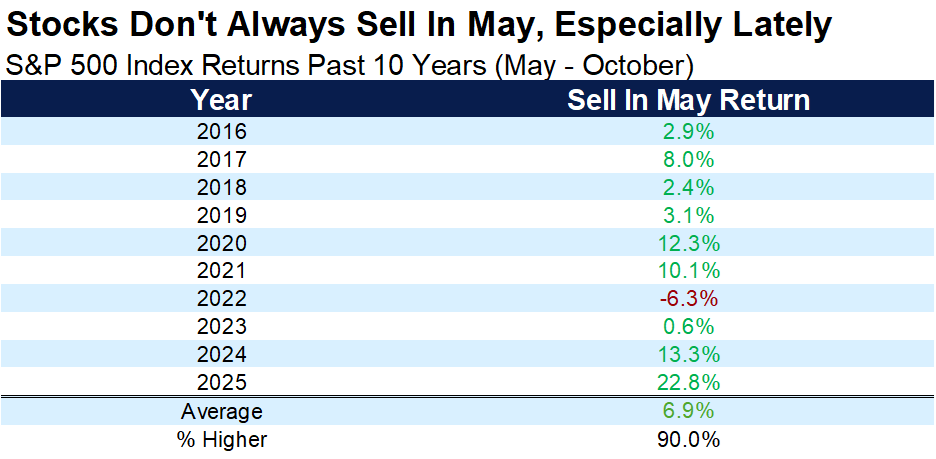 Source: Carson Group, FactSet, @ryandetrick
Another chart segments six month forward returns by the market’s condition at the start of the period, contrasting years that entered May with gains above a modest threshold against those that began in negative territory. When the index is already up more than 4% year‑to‑date, the forward May–October bar doubles relative to the unconditional seasonal average, rising into the mid‑single digit range, while the percentage of positive outcomes climbs as well. In contrast, years that begin with a negative return show weaker returns and a higher incidence of negative outcomes, suggesting that trend and underlying macro context matter more than the page on the calendar.
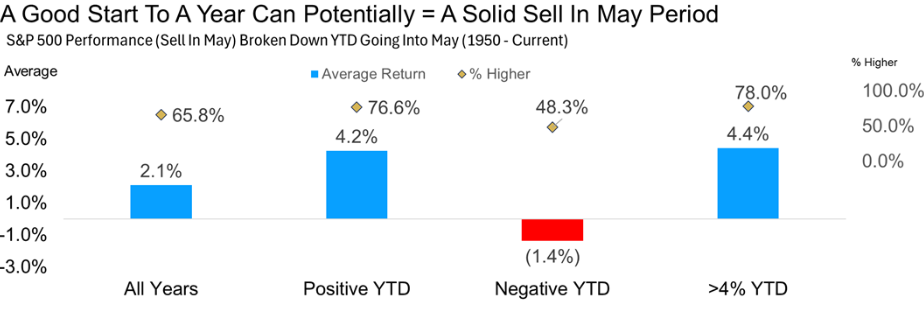 Source: Carson Investment Research, FactSet, @ryandetrick
The final chart takes a different angle, lining up every historical instance of a double‑digit monthly gain in the index and tracking performance over the subsequent one, three, six, and twelve months. The one-month column shows only a modest average gain of 0.8%, with a coin‑flip chance of being higher or lower; a reminder that markets often consolidate after sharp surges. Yet as the horizon extends, the statistics tilt decisively upward and far above average for all other periods: three months forward returns average just under 5% with about three quarters of outcomes being positive, while six- and twelve-month figures move into double‑digit territory with positive results in 85% of cases. Taken together, the charts imply that strong momentum and a constructive starting backdrop can overwhelm seasonal anxieties, making a rigid “sell in May” approach less compelling than a disciplined, context-aware strategy.
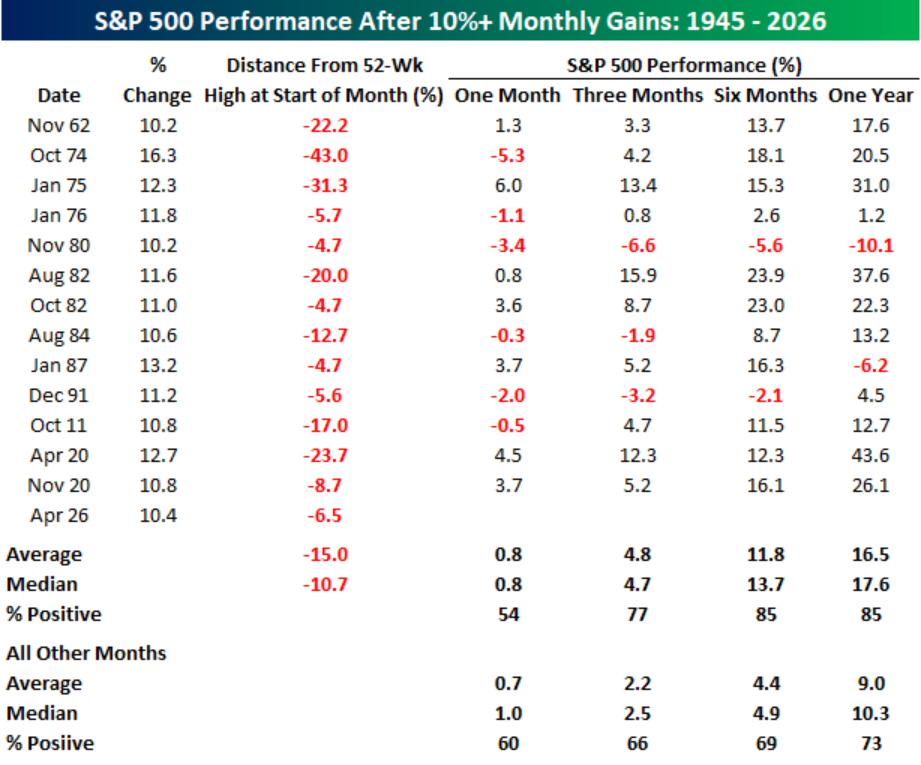 Source: Bespoke Investment Group
Sources: Yahoo Finance, The Canadian Press, Energy Now, Fox Business, Al Jazeera, First Trust, Carson Investment Research, Carson Group, FactSet, @ryandetrick, Bespoke Investment Group
©2026 Milestone Wealth Management Ltd. All rights reserved.
DISCLAIMER: Investing in equities is not guaranteed, values change frequently, and past results are not necessarily an indicator of future performance. Investors cannot invest directly in an index. Index returns do not reflect any fees, expenses, or sales charges. Opinions and estimates are written as of the date of this report and may change without notice. Any commentaries, reports or other content are provided for your information only and are not considered investment advice. Readers should not act on this information without first consulting Milestone, their investment advisor, tax advisor, financial planner, or lawyer. This communication is intended for Canadian residents only and does not constitute as an offer or solicitation by anyone in any jurisdiction in which such an offer is not allowed.