Market Insights: Reclaiming Momentum After Geopolitical Fears
Milestone Wealth Management Ltd. - Apr 17, 2026
Macroeconomic and Market Developments:
- North American markets were up strongly this week. In Canada, the S&P/TSX Composite Index closed 1.93% higher, while in the U.S., the Dow Jones Industrial Average increased by 3.19% and the S&P 500 Index rose 4.54%.
- The Canadian Dollar rose slightly this week, closing at 73.01 vs. 72.26 cents USD last week.
- Oil prices plummeted this week, with U.S. West Texas Crude closing at US$83.00 vs. US$95.83 last week.
- The price of Gold rose this week closing at US$4,861 vs. US$4,769 last week.
- U.S. producer prices rose 0.5% in March (4.0% y/y)—below expectations—driven largely by an 8.5% surge in energy costs, while underlying pressures remained more contained with core PPI up just 0.1% m/m (3.8% y/y), highlighting a mixed inflation backdrop; economists Brian S. Wesbury and Robert Stein note that while energy-driven volatility—linked in part to geopolitical tensions—continues to cloud the outlook, broader inflation trends remain relatively stable, leaving the Federal Reserve likely to hold rates in the near term, with potential for rate cuts later in the year if energy prices normalize.
- U.S. equities extended their sharp rebound, with the Nasdaq Composite achieving a 13-day winning streak—its longest since 1992—and its strongest three-week rally since 2020, as renewed strength in Big Tech and semiconductors drove gains across major indices; investor sentiment has notably shifted back toward growth names, with the “Magnificent Seven” adding ~$2.5T in market value over eight days and strong inflows into tech ETFs, highlighting a powerful rotation back into AI and mega-cap leaders following an oversold period, while momentum and small-cap stocks have also participated in the broader market recovery.
- Oil prices fell sharply, with WTI dropping over 10% to below $85 and Brent to ~$89, after Iran’s Foreign Minister Abbas Araghchi confirmed the Strait of Hormuz would remain open to commercial shipping during a ceasefire, easing fears of a prolonged supply disruption after prices had previously surged above $100 amid the Iran conflict; while Donald Trump indicated a naval blockade on Iran would remain in place, the reopening of a route that handles ~20% of global oil flows has improved near-term supply expectations, with analysts suggesting lower oil prices could help ease inflation pressures if stability persists, though uncertainty around security and shipping conditions remains elevated.
- Canada’s Weston family’s real estate platform Choice Properties REIT and KingSett Capital have agreed to acquire and split First Capital REIT in a ~$9.4B (incl. debt) transaction, with Choice taking ~$5B of grocery-anchored neighbourhood centres and KingSett acquiring ~$4.4B of high-street retail assets, spanning 136 communities across Canada; the deal strengthens Choice’s urban and grocery exposure while reflecting renewed confidence and consolidation in Canadian commercial real estate, as high-quality retail assets attract institutional capital despite a still-challenging macro backdrop.
Weekly Diversion:
Check out this video: It went worse than I thought
Charts of the Week
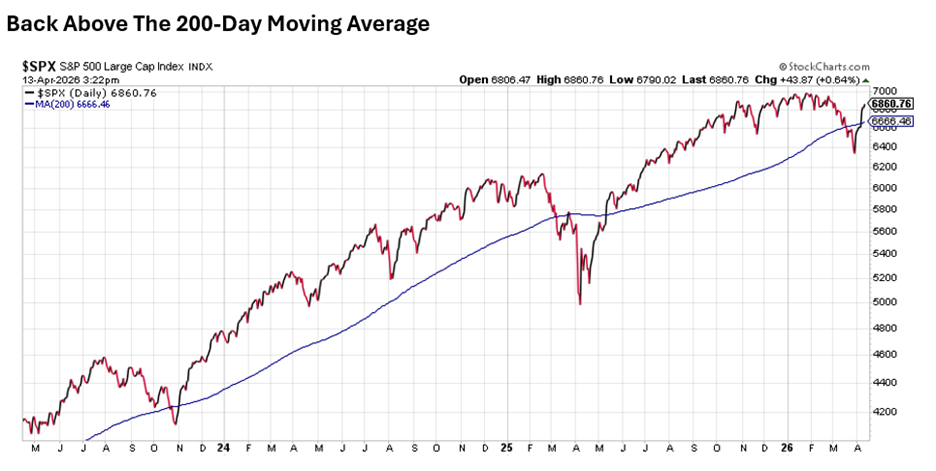
The headlines remain choppy, but there are signs the worst of the war related sell-off in Iran may be behind us.
The first indication is this chart showing the S&P 500 Index’s move relative to its long-term trend line, the 200‑day moving average. After spending nearly two weeks below that line, the index recaptured it, a behavior that previous cycles have often associated with a transition from downside risk to renewed upside momentum. Markets tend not to experience their worst declines when they are already rebounding above a rising long‑term trend; instead, the deepest damage usually comes when price is breaking down beneath it. The chart’s message is not that risk has vanished, but that the “danger zone” associated with prolonged breaks below the 200‑day has likely passed, for now.
 Source: Carson Investment Research, StockCharts.com
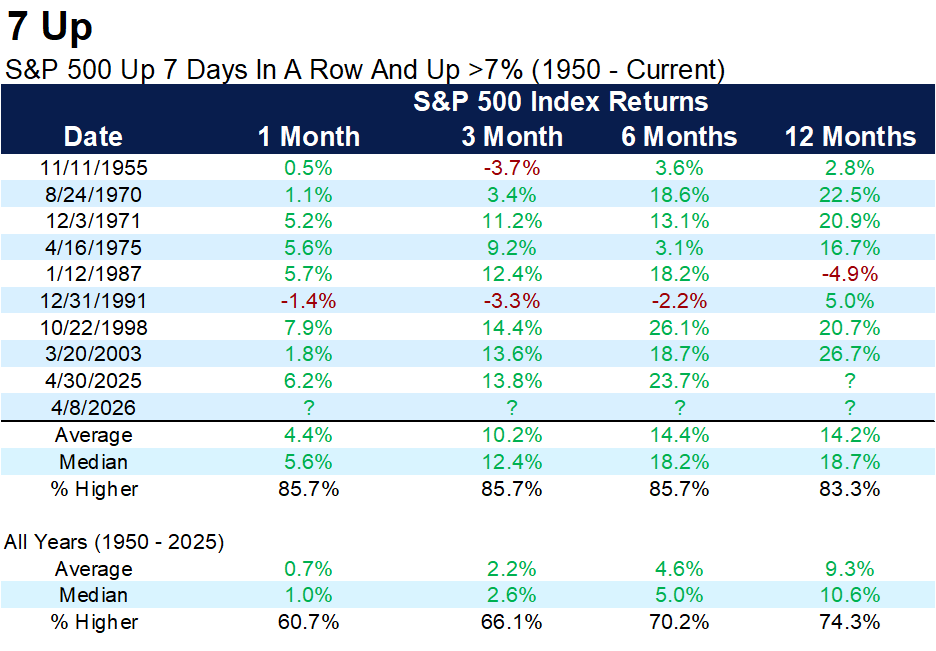
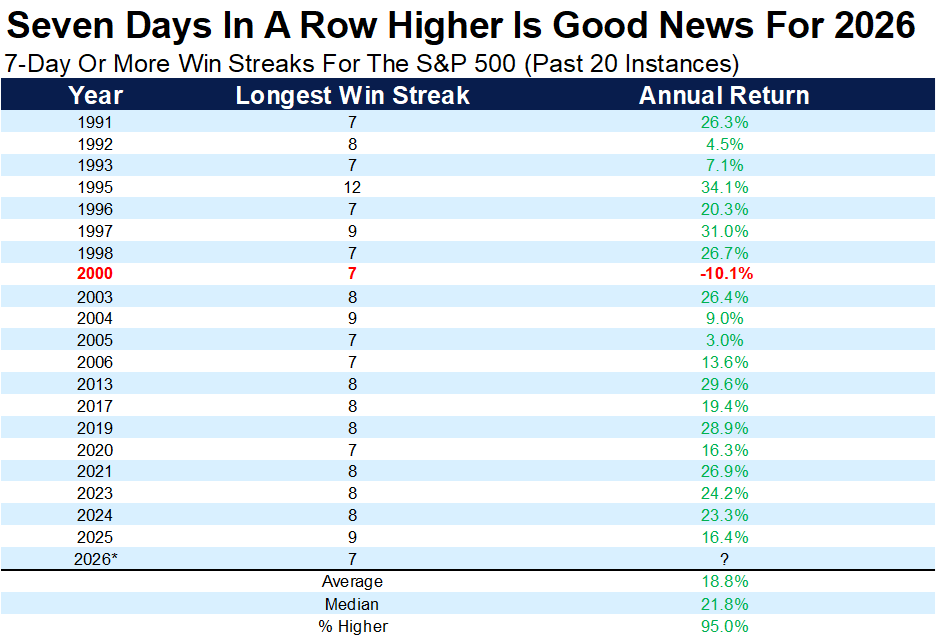
The next two tables highlight short-term “buying thrusts” that have historically marked important turning points. The first one shows a rare seven‑day winning streak in the S&P 500 index combined with a gain of more than 7% over that span, and overlays forward return statistics from the prior instances. The visual impact is striking: all but one instance was positive over 6 and 12 months, with average gains in the low double digits just three months out and even stronger outcomes six months later. The second chart extends this idea by marking calendar years that contained such streaks, showing that almost all of them finished higher for the year, reinforcing the notion that powerful short bursts of strength often appear near the start of durable uptrends rather than at their end.
 Source: Carson Investment Research, FactSet, @ryandetrick
 Source: Carson Investment Research, FactSet, @ryandetrick
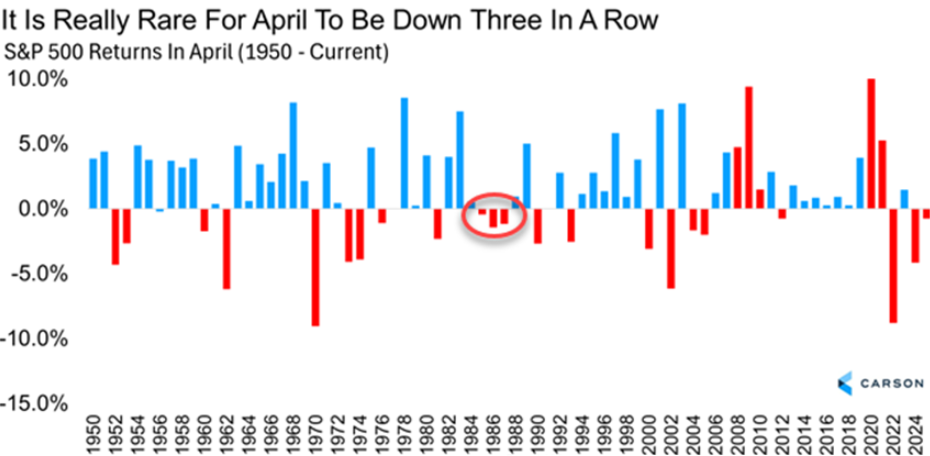
Seasonality adds a third layer to the argument. The seasonal bar chart centered on April shows that while the month was negative in the previous two years, a third consecutive decline has occurred only once in the historical sample, hinting that the odds modestly favor a better outcome this time.
 Source: Carson Investment Research, FactSet, @ryandetrick
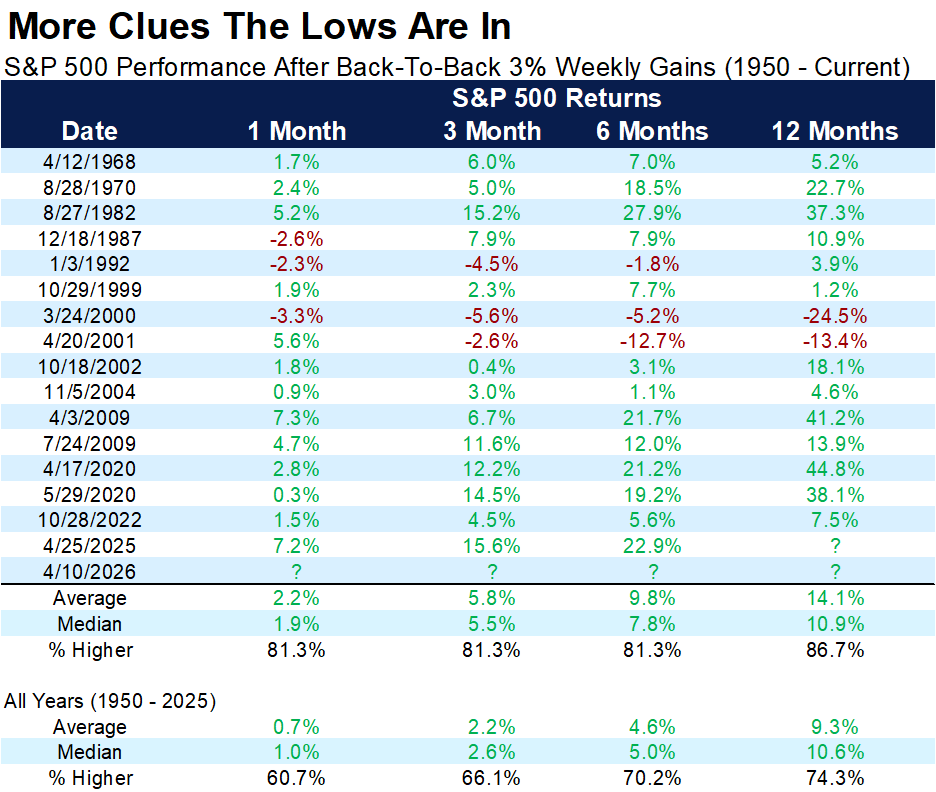
Momentum over slightly longer horizons are captured in the chart below. This figure marks each historical occurrence of back-to-back 3%+ weekly gains and then plots the index’s performance over the subsequent year, showing that in most cases the market was higher twelve months later. Notably, the chart’s annotations point out that even when this pattern appeared near major macro stress episodes—such as the early‑2000s tech unwind—positive one‑year outcomes were still more common than not. For an investor, the visual suggests that consecutive strong weeks are less a sign of “overbought and doomed to fail” and more an indication of robust demand returning after a period of weakness.
 Source: Carson Investment Research, FactSet, @ryandetrick
Taken together, the charts form a coherent narrative of a market that has been tested by geopolitical shock and fearful positioning, yet has responded with improving trend behavior, and rare upside thrusts. None of these visuals promise a smooth path forward, and they explicitly acknowledge that new negative developments could always alter the picture.
Sources: Yahoo Finance, The Canadian Press, First Trust, Market Watch, Fox Business, Western Investor Richardson Wealth, Carson Investment Research, FactSet, StockCharts.com, @ryandetrick
©2026 Milestone Wealth Management Ltd. All rights reserved.
DISCLAIMER: Investing in equities is not guaranteed, values change frequently, and past results are not necessarily an indicator of future performance. Investors cannot invest directly in an index. Index returns do not reflect any fees, expenses, or sales charges. Opinions and estimates are written as of the date of this report and may change without notice. Any commentaries, reports or other content are provided for your information only and are not considered investment advice. Readers should not act on this information without first consulting Milestone, their investment advisor, tax advisor, financial planner, or lawyer. This communication is intended for Canadian residents only and does not constitute as an offer or solicitation by anyone in any jurisdiction in which such an offer is not allowed.