Market Insights: Lessons from Today’s Volatility
Milestone Wealth Management Ltd. - Mar 27, 2026
Macroeconomic and Market Developments:
- North American markets were vastly mixed this week. In Canada, the S&P/TSX Composite Index closed 2.05% higher, while in the U.S., the Dow Jones Industrial Average fell by 0.90% and the S&P 500 Index decreased 2.12%.
- The Canadian Dollar fell this week, closing at 72.01 vs. 72.88 cents USD last week.
- Oil prices rose this week, with U.S. West Texas Crude closing at US$99.93 vs. US$97.64 last week.
- The price of Gold increased slightly this week closing at US$4,540 vs. US$4,508 last week.
- Canadian housing remains under sustained pressure, with BMO Capital Markets warning the market is in its largest correction since the 1990s, as weak demand and elevated supply push key indicators like the sales-to-new-listings ratio to decade lows for February; after surging 56.7% (+$299K) from April 2020 to a peak of $827,600 (Feb 2022), national home prices have since declined 20.1% (-$166K) to $661,100 (Feb 2026)—effectively erasing gains since early 2021—while in real (inflation-adjusted) terms, prices are down nearly 30% and have shown no appreciation for ~9 years, with economist Robert Kavcic noting the downturn resembles the prolonged 1990s cycle and cautioning that with inflation expected to rise further, downward pressure on real home prices is likely to persist, with a meaningful recovery potentially delayed until later in the decade.
- The Government of Canada announced $28.9 million in funding through its Energy Innovation Program to support clean technology development, with the largest allocation directed toward carbon capture, utilization and storage (CCUS) projects, including nearly $15 million for two Saskatchewan-based initiatives, alongside over $9 million for solar energy projects and additional funding for smart grid technologies aimed at improving electricity efficiency—reflecting continued federal efforts to enhance energy reliability while advancing emissions reduction and clean energy innovation.
- The Trump administration is further ramping up its pro-technology agenda, appointing David Sacks as co-chair of the President’s Council of Advisors on Science and Technology (PCAST) while he retains his AI and crypto czar role. The council will include up to 24 members featuring major industry leaders such as Jensen Huang, Mark Zuckerberg, and Larry Ellison. Recent policy actions—including a national AI framework with 90+ initiatives, the rollback of prior regulatory constraints, the creation of a Strategic Bitcoin Reserve, and passage of the GENIUS Act establishing a federal stablecoin framework—signal a clear shift toward innovation-first regulation aimed at strengthening U.S. leadership in artificial intelligence and digital assets.
- The Federal Reserve reported an operating loss of ~$18.7B in 2025—its third consecutive annual loss, though improving from prior years as rate cuts and lower interest expenses stabilize its balance sheet; however, with cumulative losses exceeding $210B, some Economists have sharply criticized leadership under Jerome Powell, arguing the central bank has become increasingly detached from accountability, pointing to costly projects and policy decisions as emblematic of an institution they view as overextended.
- Clarke Inc. has agreed to acquire Ravelin Properties REIT in an all-stock transaction valuing the business at ~$1.1B (including debt), as Ravelin navigates financial challenges including debt defaults and capital pressures. Underscoring ongoing consolidation trends within commercial real estate as firms adapt to tighter financing conditions.
Weekly Diversion:
Check out this video: Oneil Cruz with a rough sequence in the first inning
Charts of the Week
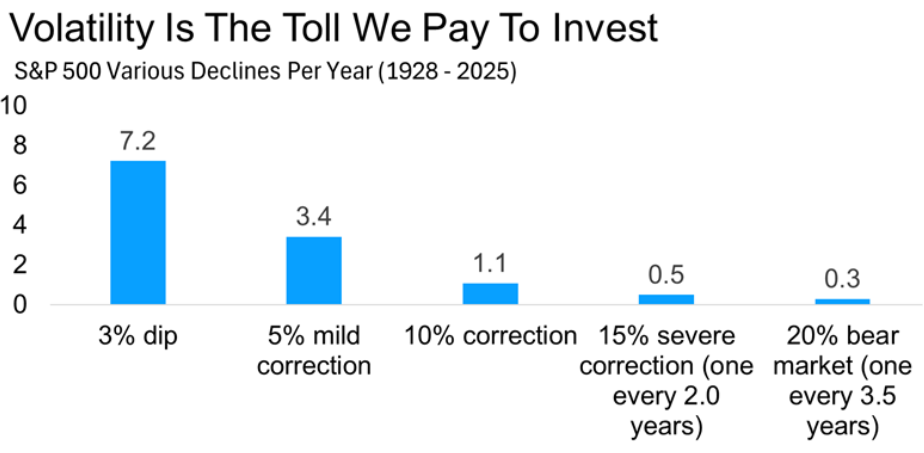
Market volatility often feels exceptional in the moment, yet a careful look at history suggests it is closer to the rule than the exception. The charts of annual pullbacks, correction frequencies, and long-term earnings trends together tell a consistent story: sharp declines are common, but they occur within an upward-sloping long-term trajectory for both corporate profits and equity markets.
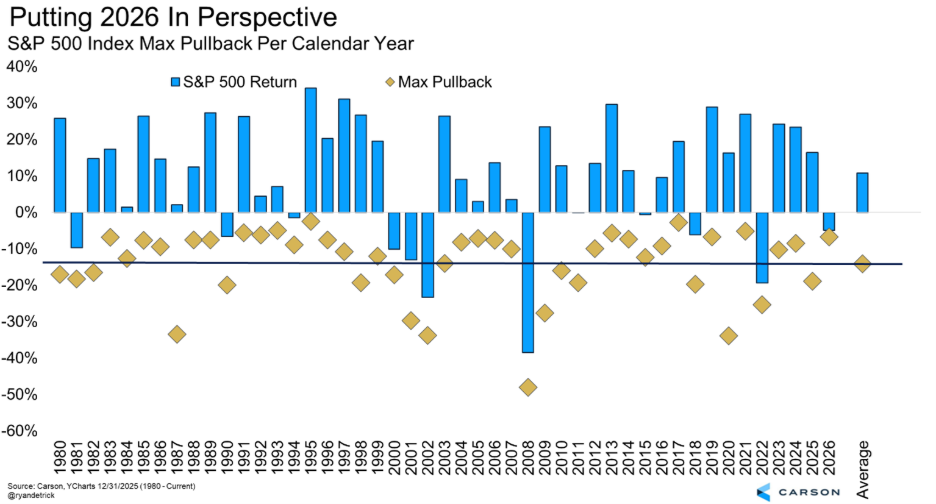
The first chart below, showing the average number of intra-year corrections, illustrates that markets typically experience at least one double-digit drawdown and several smaller pullbacks in a given year. Rather than being anomalies, these episodes are structurally embedded in how risk assets price changing information, and they form the “cost of admission” for long-term equity returns. The second chart, which pairs peak to trough declines with full year returns since 1980, underscores this point: even years with painful drawdowns often end with positive performance, and in some cases even strongly positive.
 Source: Carson Investment Research, Ned Davis Research, @ryandetrick
 Source: Carson Investment Research, YCharts, @ryandetrick
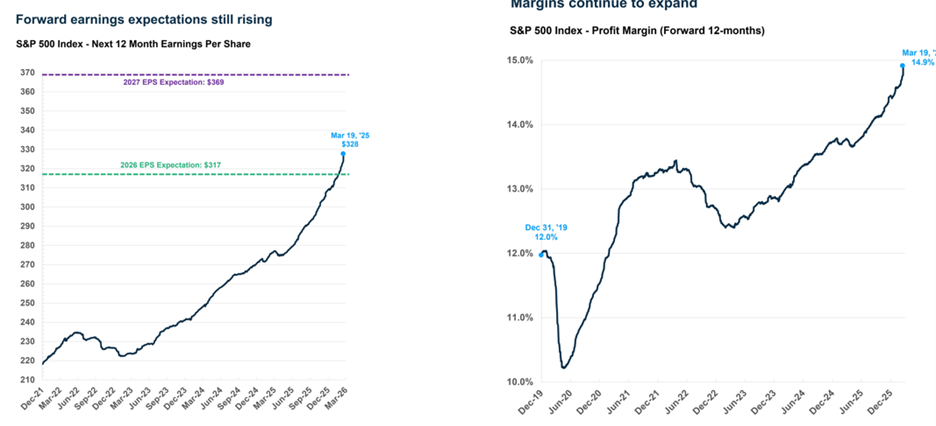
The following earnings and margin charts provide the fundamental counterpart to this price behavior. Forward earnings estimates and profit margins trend higher over time with periodic setbacks but no sustained deterioration in most periods. This pattern supports the concept that equities are ultimately driven by earnings growth, and that prices tend to recover once temporary shocks or sentiment swings fade and the underlying earnings path reasserts itself.
 Source: Carson Investment Research, Factset, @sonusvarghese
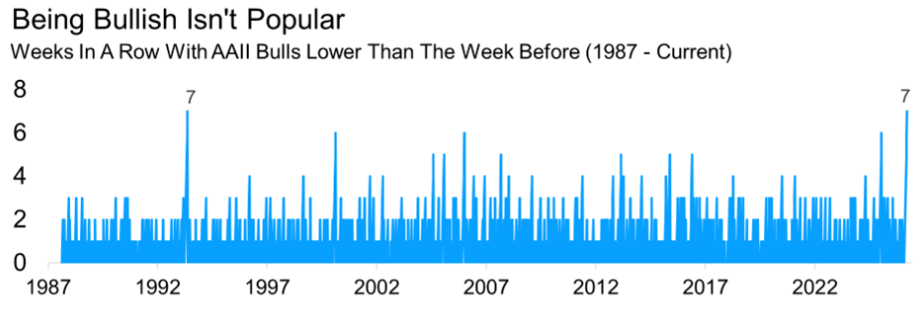
Sentiment indicators, such as the charted decline in bullish readings among individual investors, add a behavioral layer. They show that fear often spikes well beyond what fundamentals alone would justify, especially after sharp but not unprecedented pullbacks. Historically, such extremes in pessimism have coincided with, or slightly preceded, attractive forward return periods, reflecting the tendency for markets to overshoot to the downside when emotions dominate.
 Source: Carson Investment Research, AAII, @ryandetrick
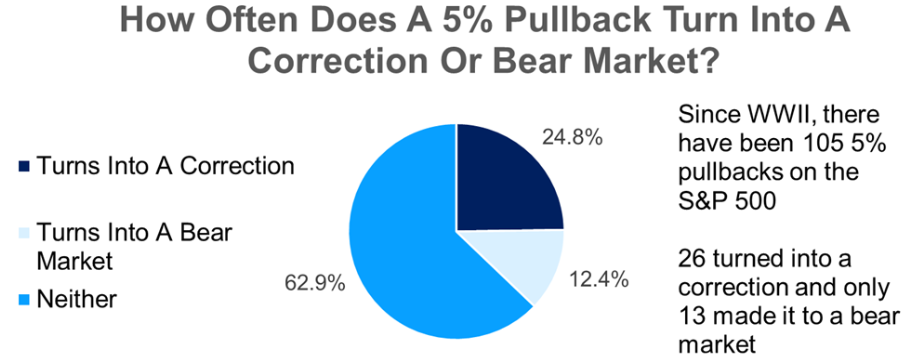
Finally, the long history of 5%, 10%, and 20% declines mapped against subsequent market paths puts the current drawdown into perspective. The probabilities shown in the chart below suggest that while deeper bear markets are always possible, the base case after a modest pullback is a stabilization and eventual resumption of the prior trend rather than a prolonged collapse. Taken together, the charts argue for an investing approach that anticipates volatility, respects the central role of earnings, and views extreme shifts in sentiment as potential opportunities rather than automatic warnings to retreat.
 Source: Carson Investment Research, Factset, @ryandetrick
Sources: Yahoo Finance, The Wall Street Journal, Bloomberg, @drjstrategy, The Canadian Press, Fox Business, Better Dwelling, Carson Investment Research, Ned Davis Research, @ryandetrick, YCharts, AAII, Factset, @sonusvarghese
©2026 Milestone Wealth Management Ltd. All rights reserved.
DISCLAIMER: Investing in equities is not guaranteed, values change frequently, and past results are not necessarily an indicator of future performance. Investors cannot invest directly in an index. Index returns do not reflect any fees, expenses, or sales charges. Opinions and estimates are written as of the date of this report and may change without notice. Any commentaries, reports or other content are provided for your information only and are not considered investment advice. Readers should not act on this information without first consulting Milestone, their investment advisor, tax advisor, financial planner, or lawyer. This communication is intended for Canadian residents only and does not constitute as an offer or solicitation by anyone in any jurisdiction in which such an offer is not allowed.