Market Insights: When Bears Roar, Markets Can Whisper Opportunity
Milestone Wealth Management Ltd. - Mar 20, 2026
Macroeconomic and Market Developments:
- North American markets were down again this week. In Canada, the S&P/TSX Composite Index closed 3.76% lower, while in the U.S., the Dow Jones Industrial Average fell by 2.11% and the S&P 500 Index decreased 1.90%.
- The Canadian Dollar rose slightly this week, closing at 72.88 vs. 72.79 cents USD last week.
- Oil prices declined this week, with U.S. West Texas Crude closing at US$97.64 vs. US$98.77 last week.
- The price of Gold came crashing down this week closing at US$4,508 vs. US$5,026 last week.
- Canadian retail sales rose 1.1% in January to $70.7B, with gains across six of nine subsectors, led by a 2.0% increase in motor vehicle and parts sales, while core retail sales rose 0.9%, indicating broad-based consumer strength. Economists suggest the solid start reflects the impact of prior rate cuts and improved labour market conditions, supporting consumer sentiment and spending, with early estimates pointing to a further 0.9% gain in February. While this momentum is expected to support Q1 GDP growth (around ~1.1%), some caution that rising gas prices could pressure household purchasing power later in the year, potentially weighing on consumption.
- Canada is expanding financial support for farmers and agribusinesses amid rising costs tied to the Iran conflict, allowing eligible borrowers to access up to C$500,000 in additional credit, loan deferrals, and flexible terms through Farm Credit Canada. The move comes as fertilizer and energy prices surge following disruptions in the Strait of Hormuz, which has constrained global supplies of key inputs like urea and sulphur ahead of the spring planting season. The support aims to help stabilize the agriculture sector against short-term cost shocks, though it highlights growing pressure on food production and input costs.
- The Bank of Canada held its policy rate at 2.25%, citing a weaker domestic economy alongside rising uncertainty from the Iran conflict, while warning that higher oil prices (near $100/barrel) will push inflation higher in the short term. The Bank faces a policy trade-off between slowing growth and inflation risk, with GDP having contracted 0.6% in Q4 and the labour market softening, but inflation previously near target. Policymakers noted they would likely be discussing rate cuts if not for inflation pressures, opting instead for a cautious, wait-and-see approach. However, some economists argue the Bank is misreading the shock, suggesting higher energy prices are ultimately deflationary—squeezing real incomes, consumption, and investment—and warn that maintaining tight policy into a weakening economy risk amplifying the slowdown into a policy-driven recession.
- Canada and key allies signalled readiness to help restore safe passage through the Strait of Hormuz, a critical global shipping route now effectively disrupted by the Iran conflict, where roughly 20% of global oil supply flows. The disruption has already driven a spike in energy prices, with Canadian gas prices rising to around $1.70/L, up nearly 20 cents year-over-year. While specific actions remain unclear, the coordinated response underscores growing geopolitical risk to global energy markets, with ongoing tensions threatening further supply disruptions, higher oil prices, and broader inflationary pressure if shipping through the strait is not stabilized.
- Insurance giant Chubb is launching war-risk insurance coverage for vessels transiting the Strait of Hormuz, partnering with a $20 billion U.S.-backed Maritime Reinsurance Plan to help restore commercial shipping through the conflict-hit region. With roughly 20% of global oil flows passing through the strait, the lack of insurance has been a key barrier to shipping, as standard policies exclude war risk and premiums surge in conflict zones. The initiative aims to stabilize maritime trade and energy supply chains.
- Super Micro shares plunged 28% after U.S. authorities charged its co-founder and others with smuggling over $2.5 billion worth of AI technology to China, raising significant regulatory and reputational risks for the company despite it not being named as a defendant. The case underscores intensifying enforcement of U.S. export controls on advanced AI chips, with potential implications for global supply chains and customer relationships. Analysts warn the situation could pressure revenue and shift demand toward competitors like Dell, as clients reassess supplier risk in the increasingly sensitive AI hardware market.
Weekly Diversion:
Check out this video: The Madness has begun
Charts of the Week
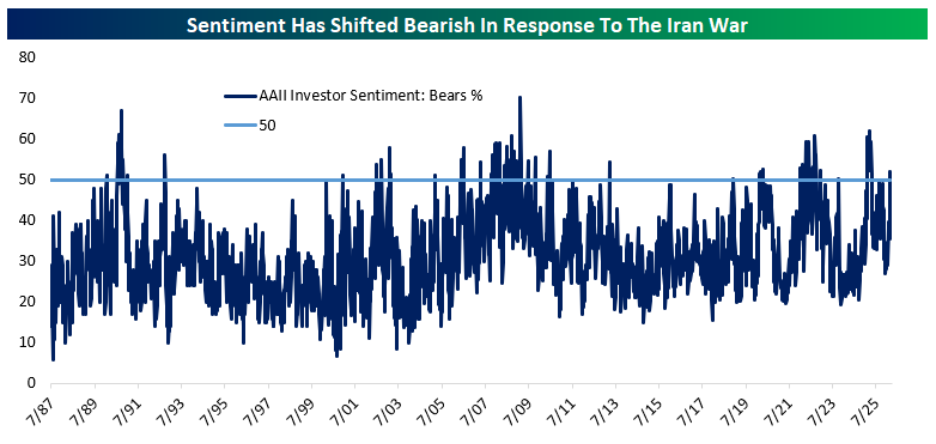
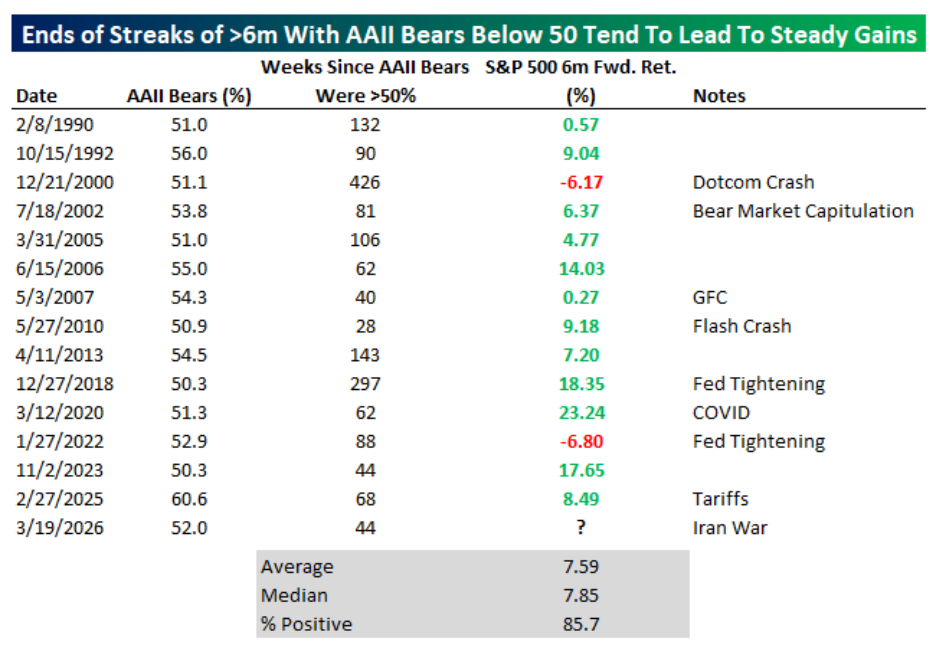
Investor sentiment and trend signals often tell different stories, and the following charts highlight how that tension can create opportunity rather than simply risk. The first chart tracks episodes when bearish responses in a popular individual investor survey suddenly jump above half of all respondents after at least six months of subdued pessimism. The table beneath that chart shows that, across these historical episodes stretching back to the late 1980s (with the first streak ending in early 1990), six-month forward returns for a broad equity index have been positive in the large majority of cases, with average gains in the mid-single to high-single digits. Only a small handful of instances, typically associated with major market breaks such as the dotcom collapse or aggressive policy tightening, resulted in negative performance half a year later. The implication is that abrupt spikes in fear tend to arrive late in the cycle of market weakness and have historically been a lagging, contrarian indicator rather than a reliable warning of fresh, deep declines.
 Source: Bespoke Investment Group
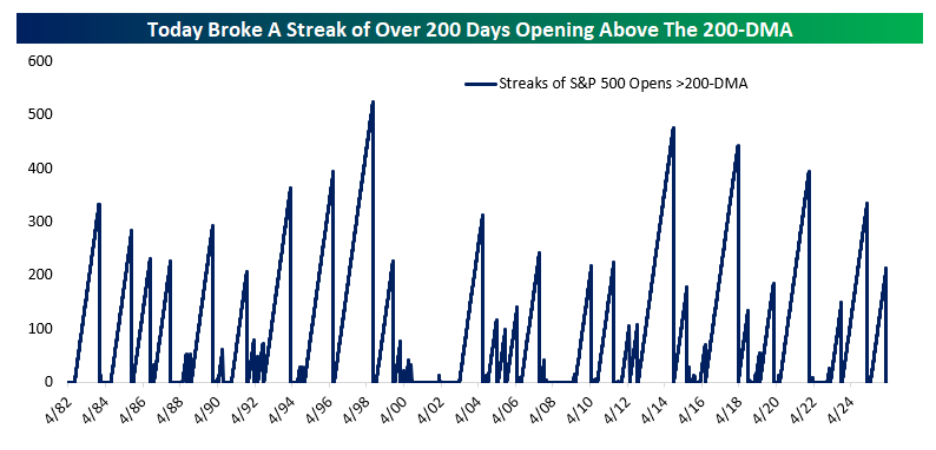
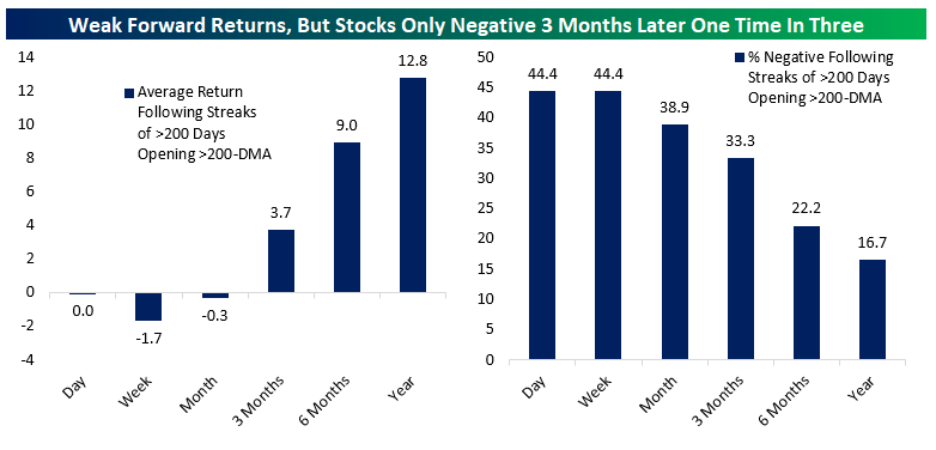
The next chart focuses not on what investors say but on how price behaves around a widely watched technical yardstick: the 200-day moving average of the S&P 500. It marks the end of a notably long streak—over 200 trading days—during which the index opened each session above this moving average, and then documents what typically happens after similar streaks are broken. The accompanying data in the bar chart below on forward returns show that while the immediate aftermath (over the next day, week, and even month) often brings weaker performance or pullbacks, the three--, six, and twelve-month windows are more often characterized by gains than losses. In fact, the frequency of negative outcomes diminishes as the horizon lengthens, echoing the message of the sentiment chart that near-term turbulence does not preclude, and may even set the stage for, longer-term advances.
 Source: Bespoke Investment Group
Together, these charts sketch a picture of a market where “roaring” pessimism and broken uptrends can co-exist with constructive medium-term prospects outside of large-scale economic recessions which is not currently present. Short interest and cash balances may rise, surveys may show a majority of participants expecting further declines, and key moving average thresholds may give way, all of which can pressure prices in the short run. Yet the historical record summarized in the tables suggests that such environments have more often marked transition points rather than starting points—moments when selling has already done much of its work and when subsequent returns, on average, have been respectable. For investors, the charts argue against extrapolating the current mood or price action too far into the future and in favor of distinguishing between short-term noise and the longer-term tendencies that past cycles reveal.
Sources: Yahoo Finance, First Trust, Bloomberg, @drjstrategy, The Financial Post, Bespoke Investment Group
©2026 Milestone Wealth Management Ltd. All rights reserved.
DISCLAIMER: Investing in equities is not guaranteed, values change frequently, and past results are not necessarily an indicator of future performance. Investors cannot invest directly in an index. Index returns do not reflect any fees, expenses, or sales charges. Opinions and estimates are written as of the date of this report and may change without notice. Any commentaries, reports or other content are provided for your information only and are not considered investment advice. Readers should not act on this information without first consulting Milestone, their investment advisor, tax advisor, financial planner, or lawyer. This communication is intended for Canadian residents only and does not constitute as an offer or solicitation by anyone in any jurisdiction in which such an offer is not allowed.