Market Insights: Strait Risks and Thin Buffers Reveal Oil Market Vulnerability
Milestone Wealth Management Ltd. - Mar 13, 2026
Macroeconomic and Market Developments:
- North American markets were down this week. In Canada, the S&P/TSX Composite Index closed 1.64% lower, while in the U.S., the Dow Jones Industrial Average fell by 1.99% and the S&P 500 Index declined 1.60%.
- The Canadian Dollar dropped this week, closing at 72.79 vs. 73.65 cents USD last week.
- Oil prices rose again this week, with U.S. West Texas Crude closing at US$98.77 vs. US$90.49 last week.
- The price of Gold came down this week closing at US$5,026 vs. US$5,161 last week.
- U.S. inflation remained stable in February, with the Consumer Price Index rising 0.3% on the month and 2.4% year-over-year, while core CPI increased 0.2% and 2.5% annually, both in line with expectations. Headline inflation was driven mainly by energy (+0.6%) and food (+0.4%), while housing rents — a key driver of core inflation in recent years — showed signs of moderating. Importantly, real wages continued to improve, with real average hourly earnings rising 0.2% in February and 1.4% over the past year, supporting household purchasing power. Overall, the data suggests inflation is gradually easing but remains above the Federal Reserve’s 2% target, meaning policymakers are likely to maintain current interest rates in the near term, with potential rate cuts pushed further into 2026 if the downward trend continues.
- A sharp decline in U.S. federal government spending — which fell at a 16.7% annualized rate in Q4 — was the primary drag on economic growth, contributing to an overall 5.8% decline in government purchases and reducing headline GDP by roughly 1 percentage point, the largest drag since 2020. As a result, real GDP growth was revised down to a 0.7% annualized pace from 1.4% previously reported. Despite the weaker headline figure, private-sector activity remained more resilient, with “core” GDP (consumer spending, business investment and residential construction) growing at a 1.9% annual rate. The report also showed persistent price pressures, with the GDP price index revised higher to 3.8%, reflecting a combination of slower growth and elevated inflation pressures heading into 2026.
- U.S. personal income rose 0.4% in January and consumer spending increased 0.4%, slightly ahead of expectations, with private-sector wages and salaries rising 0.6% and dividend income also strengthening. Disposable income jumped 0.9%, reflecting both higher earnings and seasonal increases in government transfers such as Social Security cost-of-living adjustments. Inflation remained somewhat firm — with the PCE price index (the Fed’s preferred inflation gauge) rising 0.3% in January (2.8% year-over-year) and core PCE at 3.1% — which limited real spending gains, though inflation-adjusted consumption still rose 0.1%, marking a third consecutive monthly increase. Overall, the data suggests household income and spending remain stable entering 2026.
- Canada’s labour market deteriorated sharply in February, with the economy losing roughly 84,000 jobs — one of the largest monthly declines in more than four years — pushing the unemployment rate to 6.7%. The weakness was driven primarily by a loss of 108,000 full-time positions (including 73,000 in the private sector) and was broad-based across industries, with services down 56,000 and goods-producing sectors down 28,000. Youth employment also weakened significantly, lifting the youth unemployment rate above 14%. Economists have argued the data highlights a growing disconnect between policy expectations and economic conditions, criticizing the central bank for remaining cautious on easing rates despite a rapidly weakening labour market.
- Canada’s productivity gap with the United States continues to widen, with Canadian labour productivity rising just 1.1% in 2025 compared with 2.2% in the U.S., while fourth-quarter productivity fell 0.1% in Canada versus a 2.8% increase south of the border. The gap is even more pronounced in the food sector, where U.S. productivity surged 10.1% while Canada declined, highlighting structural weaknesses in domestic processing and supply chains. Analysts note that Canada exports large volumes of raw commodities — for example 88% of its dried peas are shipped abroad without domestic processing — leaving the economy exposed to tariffs, currency swings and global disruptions. Strengthening domestic supply chains and investment in productivity could help improve resilience and address the unsustainable rise of food prices, which have already increased 22% since 2022.
Weekly Diversion:
Check out this video: They’ve taken Hockey, but tonight we can take Baseball...
Charts of the Week
Escalating tensions in the Middle East and renewed threats to key maritime routes have once again thrust energy security to the forefront of global markets. These three charts on crude flows through a critical regional chokepoint, the trajectory of U.S. emergency oil stocks, and the physical layout of Gulf Coast storage caverns together pose a central question: how well prepared is the world for a sudden, large-scale disruption in seaborne oil trade? The juxtaposition of the concentration of flows, the geography of risks and beneficiaries, and the state of strategic reserves, offer a visual roadmap for assessing both resilience and vulnerability in today’s oil market architecture.
The first chart tracking the U.S. emergency crude stockpile from the late 1970s to early 2026 shows inventories now far below prior peaks despite a notable rebound from their recent trough. Stocks climbed over decades toward authorized capacity, then dropped sharply in recent years, leaving current levels hundreds of millions of barrels under the historical high even after roughly a 20% recovery. Measured against net crude imports, the reserve still covers several months, but the thinner buffer is evident, especially if a prolonged disruption were to occur.
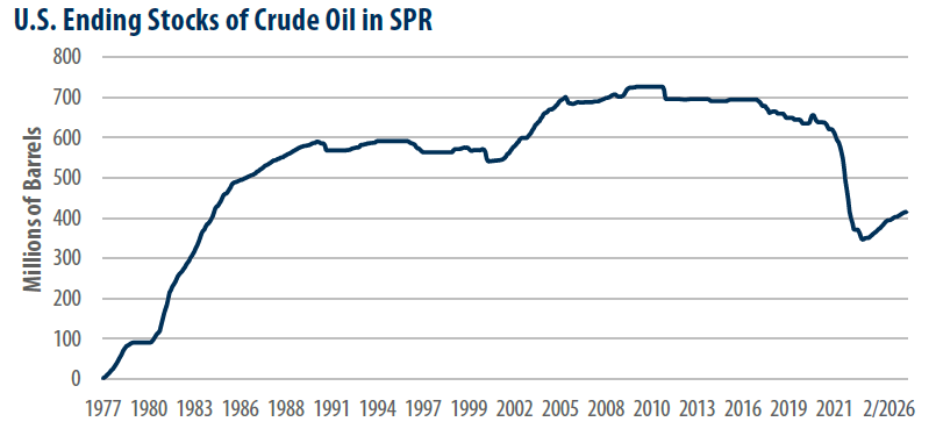 Source: U.S. Energy Information Administration, First Trust Advisors. Monthly data from 10/1977-2/2026
The next chart on crude and condensate volumes through the Strait of Hormuz between 2020 and early 2025 underlines why such a disruption would reverberate globally. Total flows rose from the low teens in millions of barrels per day, peaked near 17 million, then eased slightly, with recent data still near 14 million barrels per day. Stacked bars by origin show a diverse set of Gulf producers funneled through a single choke point, while the destination breakdown is dominated by Asian buyers such as China, India, South Korea, and Japan. The United States appears only as a thin sliver, indicating reduced direct reliance but continued exposure via key partners and global price formation.
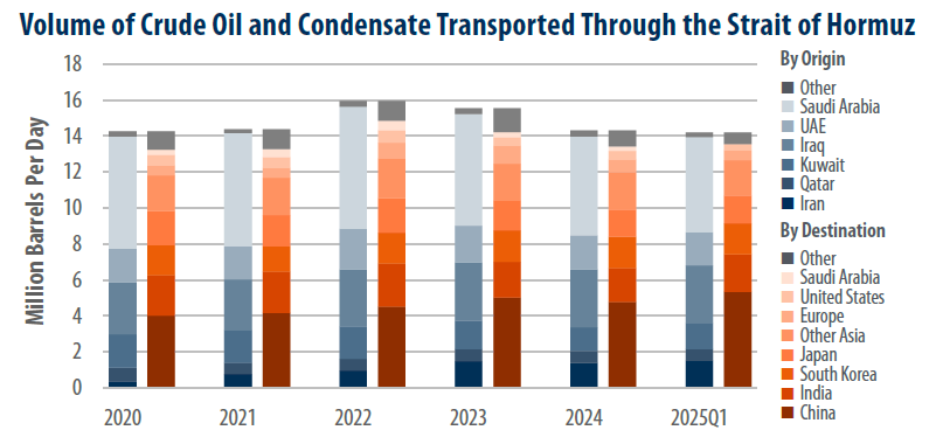 Source: U.S. Energy Information Administration, Vortexa, First Trust Advisors. Annual data 2020-2024, quarterly data for Q1 2025
The final chart zooms in on the U.S. storage system, mapping four Gulf Coast sites in Texas and Louisiana and illustrating the immense scale of individual caverns. Each site contains multiple salt caverns roughly half a mile tall and about 200 feet wide, depicted as towering above familiar landmarks to convey their sheer size. Located near almost half of U.S. refining capacity and tied into pipelines and barge routes, these facilities can move several million barrels per day into the commercial system once a release is authorized, though about a two-week lag remains before oil reaches end users.
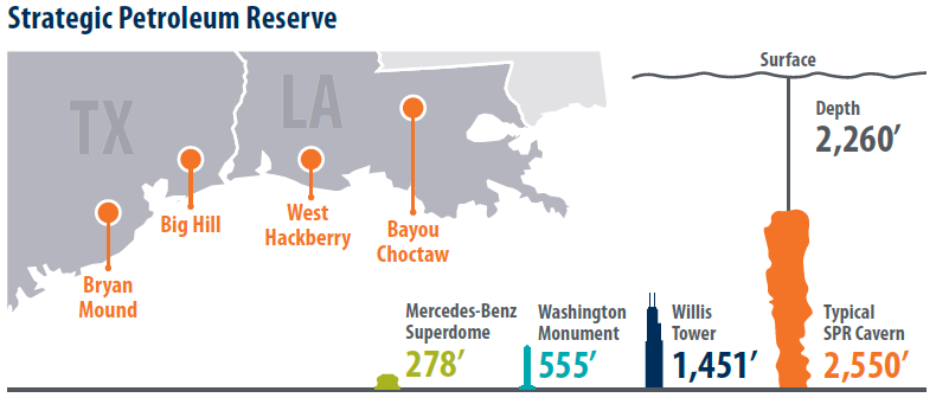 Source: Energy.gov, First Trust Advisors. Data as of 8/31/2025
Taken together, the charts depict a world in which physical infrastructure and geography still powerfully shape energy security even as production patterns evolve. The concentration of seaborne flows through a single vulnerable corridor, the heavy dependence of Asian economies on that lane, and the leaner but still critical U.S. emergency stocks show that risk has not disappeared, only changed form. The contrast of a thinner yet massive stockpile, large and regionally concentrated transit volumes, and cavernous underground storage capture the policy challenge ahead: strengthening U.S. domestic resilience while recognizing that oil is priced in a global market where disruptions in one narrow waterway can send shockwaves across continents.
Sources: Yahoo Finance, First Trust, Bloomberg, @drjstrategy, The Financial Post, U.S. Energy Information Administration, First Trust Advisors, Vortexa, Energy.gov
©2026 Milestone Wealth Management Ltd. All rights reserved.
DISCLAIMER: Investing in equities is not guaranteed, values change frequently, and past results are not necessarily an indicator of future performance. Investors cannot invest directly in an index. Index returns do not reflect any fees, expenses, or sales charges. Opinions and estimates are written as of the date of this report and may change without notice. Any commentaries, reports or other content are provided for your information only and are not considered investment advice. Readers should not act on this information without first consulting Milestone, their investment advisor, tax advisor, financial planner, or lawyer. This communication is intended for Canadian residents only and does not constitute as an offer or solicitation by anyone in any jurisdiction in which such an offer is not allowed.