Market Insights: Dispersion of Performance
Milestone Wealth Management Ltd. - Feb 20, 2026
Macroeconomic and Market Developments:
- North American markets were positive this week. In Canada, the S&P/TSX Composite Index closed 2.26% higher, while in the U.S., the Dow Jones Industrial Average inched ahead by 0.25% and the S&P 500 Index increased 1.07%.
- The Canadian Dollar pulled back this week, closing at 73.12 vs. 73.43 cents USD last week.
- Oil prices jumped higher this week, with U.S. West Texas Crude closing at US$66.49 vs. US$62.83 last week.
- The price of Gold rose again this week closing at US$5,115 vs. US$5,053 last week.
- Headline inflation in Canada eased to 2.3% in January from 2.4% in December, coming in slightly below expectations as gasoline base effects helped cool annual price growth. Prices were flat month over month, versus forecasts for a modest increase, while the BoC’s preferred core measures also eased, with the median rate slipping to 2.5% and trim to 2.4%. Shelter inflation slowed to 1.7% year over year, its first reading below 2% in nearly five years, reflecting softer rent increases and lower mortgage interest costs.
- Statistics Canada says retail sales were down 0.4 per cent at $70 billion in December as sales at new and used car dealers fell. However, the agency says its early estimate for January pointed to a gain of 1.5 per cent, though it cautioned the figure would be revised.
- Canada’s housing construction continued to slow in January, with CMHC reporting a 15% drop in the seasonally adjusted annual pace of housing starts to 238,049 units from 280,668 in December. The agency’s six-month moving average also declined 3.5%, marking a fourth consecutive monthly drop and signaling a sustained downward trend. CMHC said trade and geopolitical uncertainty, high construction costs, weaker demand, rising inventories and lower immigration levels are weighing on developer activity, with little sign of a near-term rebound.
- Mark Carney unveiled an extensive defense strategy, committing Canada to $180 billion in military procurement and $290 billion in defense-related infrastructure over the next decade, aiming to shift reliance away from U.S. suppliers and toward domestic industry. The plan would raise the share of defense contracts awarded to Canadian firms to 70% from about 30%, designate select companies as strategic partners, and build sovereign supply chains in aerospace, ammunition, and drones.
- U.S. fourth quarter Gross Domestic Product rose at an annualized rate of just 1.4%, according to the Commerce Department, well below the Dow Jones estimate for a 2.5% gain. The department estimated that the government shutdown, which ran through the first half of the quarter, took about 1 percentage point off economic growth.
Weekly Diversion:
Check out this video: Stealing the Spotlight
Charts of the Week
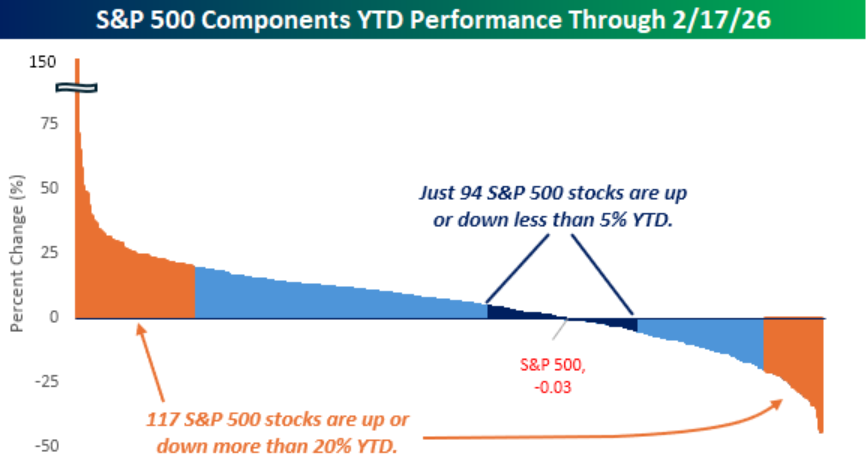
Equity indices can project an illusion of calm even as their underlying holdings experience turbulence beneath the surface. This tension between index-level stability and stock-level volatility is at the heart of the current market environment.
The first chart today, showing the share of index members moving more than 20% year-to-date (Feb. 17, 2026) versus those barely budging, underscores how unusually large the underlying swings have been. A substantial proportion of stocks have already experienced out-sized gains or losses, while the cohort with muted price moves has shrunk to one of the smallest numbers in decades, highlighting how pervasive stock-level volatility has become. Historically, similar spikes in the fraction of big movers have coincided with periods of regime change, stress, or early-cycle recovery, when investors aggressively reprice fundamentals and narratives across sectors.
 Source: Bespoke Investment Group
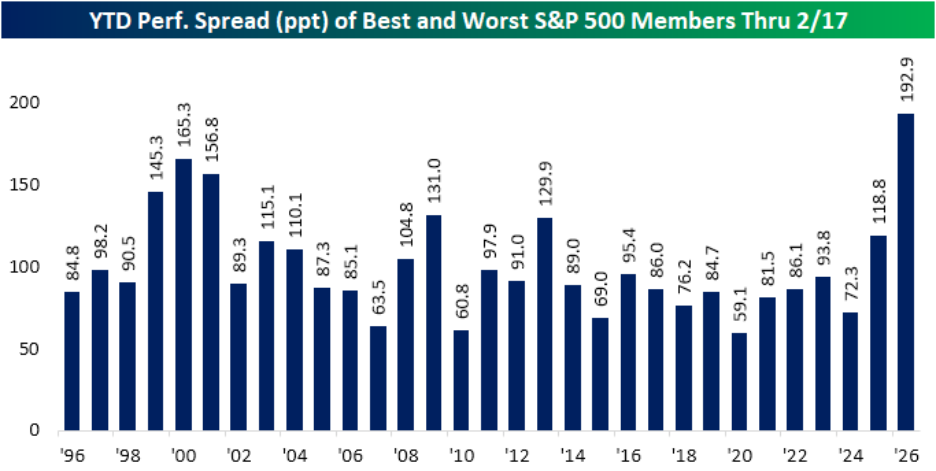
A second visual, capturing the gap between the best and worst performers, drives home the extremity of the current dispersion. The spread between the top and bottom stocks is the widest in decades, illustrating that the market is not merely “choppy,” but sharply divided into big winners and deep losers. Such a wide range of outcomes reflects both the power of unique stories—such as transformative growth or business model challenges—and the market’s willingness to rapidly reward or punish perceived future cash flows.
 Source: Bespoke Investment Group
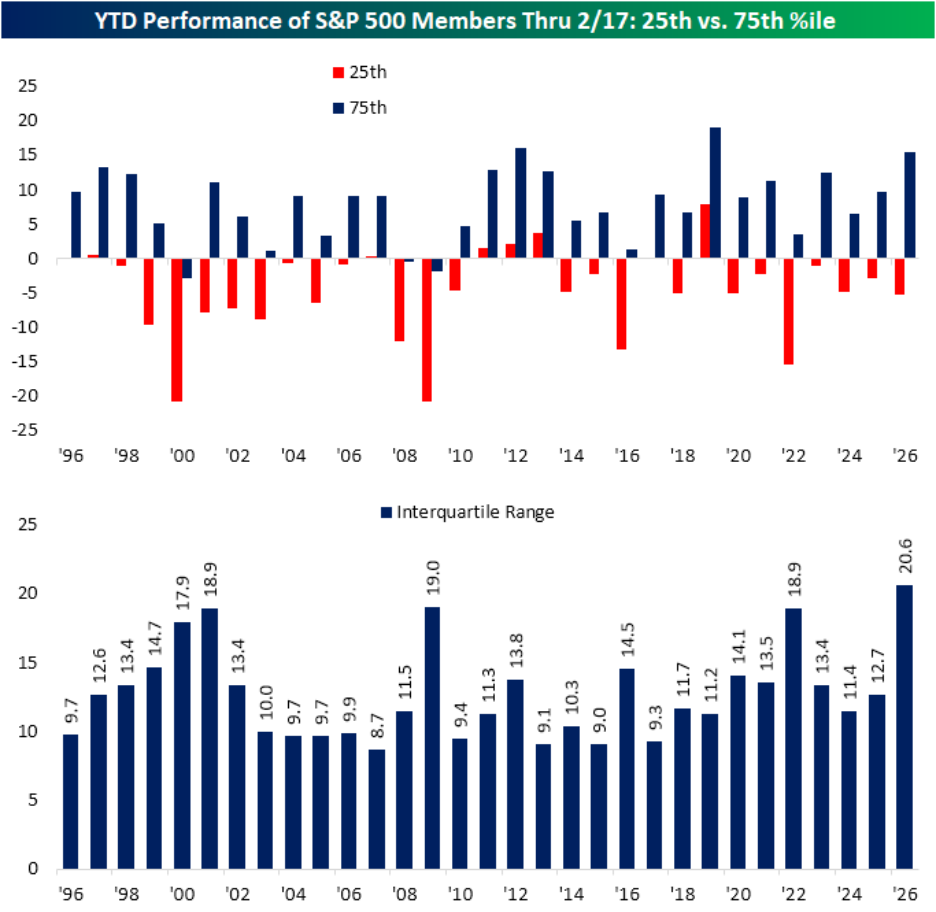
The next chart depicting the 25th and 75th percentiles of year-to-date returns, along with the interquartile range, offer a more systematic look at this dispersion. While downside at the 25th percentile is not unprecedented, the upside at the 75th percentile is unusually strong, and the resulting interquartile range is at a record, signaling that the “middle bulk” of the distribution has stretched out in both directions. This pattern suggests that stock selection and factor exposure matter far more than in calmer regimes, as the gap between a merely average pick and a strong performer has rarely been larger.
 Source: Bespoke Investment Group
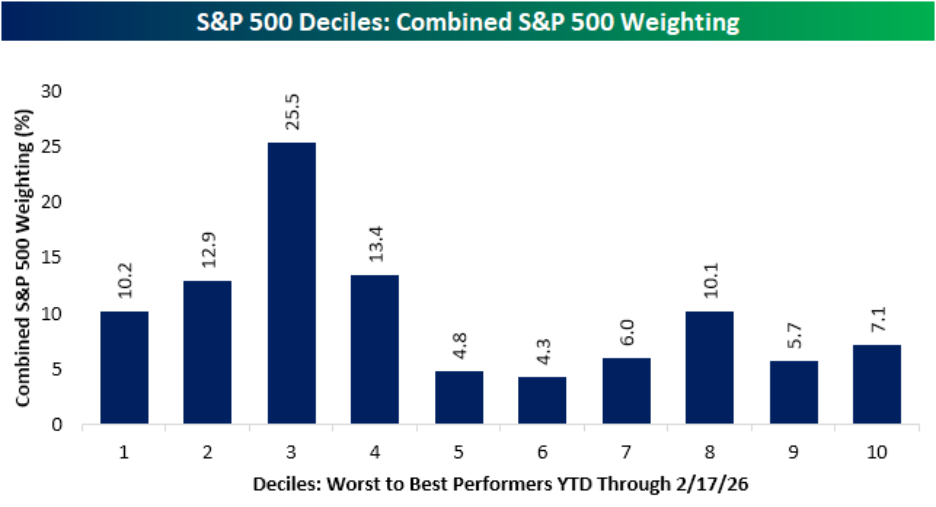
Finally, the decile chart linking performance buckets to revenue growth reveals an important nuance: the pain is concentrated where the capital is. The weakest performance deciles represent a disproportionately large share of index market capitalization and are heavily populated by high-growth businesses, while both the worst and the best deciles exhibit double-digit revenue growth. That juxtaposition implies that the market is actively repricing growth—distinguishing between expensive, crowded growth that disappoints and growth that is either underappreciated or better-supported by fundamentals. For diversified investors, this environment has quietly been rewarding breadth and balance, even as those concentrated in the largest, highest-growth names may experience a very different—and far more painful—version of “flat” index performance.
 Source: Bespoke Investment Group
Sources: Yahoo Finance, First Trust, Advisor Analyst, Financial Post, Bespoke Investment Group
©2026 Milestone Wealth Management Ltd. All rights reserved.
DISCLAIMER: Investing in equities is not guaranteed, values change frequently, and past results are not necessarily an indicator of future performance. Investors cannot invest directly in an index. Index returns do not reflect any fees, expenses, or sales charges. Opinions and estimates are written as of the date of this report and may change without notice. Any commentaries, reports or other content are provided for your information only and are not considered investment advice. Readers should not act on this information without first consulting Milestone, their investment advisor, tax advisor, financial planner, or lawyer. This communication is intended for Canadian residents only and does not constitute as an offer or solicitation by anyone in any jurisdiction in which such an offer is not allowed.