Market Insights: Roller Coaster Ride
Milestone Wealth Management Ltd. - Feb 13, 2026
Macroeconomic and Market Developments:
- North American markets were mixed this week. In Canada, the S&P/TSX Composite Index closed 1.86% higher, while in the U.S., the Dow Jones Industrial Average fell 1.23% and the S&P 500 Index dropped 1.39%.
- The Canadian Dollar increased slightly this week, closing at 73.43 vs. 73.28 cents USD last week.
- Oil prices fell this week, with U.S. West Texas Crude closing at US$62.83 vs. US$63.51 last week.
- The price of Gold rose again this week closing at US$5,053 vs. US$4,972 last week.
- U.S. nonfarm payrolls rose 130,000 in January, doubling expectations and driven by a strong 172,000 gain in private-sector hiring, particularly in education & health (+137K), professional services (+34K) and construction (+33K), while government payrolls fell 42,000. The unemployment rate edged down to 4.3% as civilian employment surged 528,000 and labor force participation improved. Wage growth remained firm, with average hourly earnings up 0.4% month-over-month (3.7% year-over-year), supporting consumer income momentum.
- U.S. retail sales stalled in December, coming in flat (-0.1% including revisions) versus expectations for a 0.4% gain, with eight of thirteen major categories declining and “core” sales (excluding autos, building materials and gas) slipping 0.1%. While the headline was soft, Q4 core sales still rose at a 2.6% annual rate versus Q3, suggesting consumer activity remains intact overall. Restaurant spending — a key services barometer — dipped modestly in December but was up 4.7% for 2025, and non-store retail sales showed solid underlying strength once seasonal distortions are stripped out. Inflation-adjusted sales were slightly negative year-over-year, reflecting lingering price effects, while stable import prices and modest export price gains point to contained pipeline inflation pressures.
- Canada’s January jobs report was a mixed signal for the economy: employment fell by ~25,000 jobs, driven largely by part-time losses, while full-time employment rose by nearly 50,000 and the unemployment rate declined to 6.5% due to a sharp drop in labour force participation. Policymakers are assessing whether weaker hiring reflects cyclical softness or demographic shifts rather than material deterioration in underlying labour-market conditions. Complicating the picture further, Oxford Economics warns Canada’s job market may be weaker than headline data suggests, noting the Labour Force Survey shows roughly 200,000 jobs added in the six months to November 2025 (310,000 year-over-year), while the payroll-based SEPH data shows a loss of 5,000 jobs over six months and just 47,000 added year-over-year. Oxford argues SEPH’s payroll data likely provides the more accurate picture, implying employment conditions are softer than widely perceived.
- Canada’s nation-building ambitions continue to clash with regulatory uncertainty, as Seabridge Gold’s $6B KSM project in B.C. — one of the world’s largest undeveloped gold-copper reserves — faces potential court-ordered setbacks despite decades of consultation, environmental approvals, and nearly $1B already invested. While Indigenous consultation is constitutionally required and widely supported, unclear timelines and evolving interpretations of “free, prior and informed consent” under UNDRIP have created legal ambiguity, with courts increasingly determining whether consultation is sufficient. Industry leaders warn that even projects deemed “substantially started” can be challenged, raising sovereign-risk concerns. At the same time, numerous First Nations have entered equity partnerships and benefit agreements across the country, highlighting that collaboration is possible — but predictability and clarity remain the missing ingredients.
- The Consumer Price Index (CPI) rose 0.2% in January, below the consensus expected +0.3%. The CPI is up 2.4% from a year ago. Energy prices declined 1.5% in January, while food prices rose 0.2%. The “core” CPI, which excludes food and energy, increased 0.3% in January, matching consensus expectations. Core prices are up 2.5% versus a year ago. Real average hourly earnings – the cash earnings of all workers, adjusted for inflation – rose 0.3% in January and are up 1.2% in the past year. Real average weekly earnings are also up 1.9% in the past year.
- Canada is poised for a major renewable-energy expansion, with up to $200B in wind, solar, and energy-storage investment projected over the next decade, according to the Canadian Renewable Energy Association. The buildout could double installed clean-power capacity, add 30–50 GW of wind, 17–26 GW of solar, and up to 16 GW of storage, supporting grid reliability and emissions reductions despite ongoing political debate over the pace and economics of the transition.
- A quiet productivity supercycle may already be underway, driven by real, measurable AI gains rather than theory. Recent data show U.S. productivity surged 4.9% in Q3 2025, alongside record highs in new orders for non-defence capital goods—a classic leading signal for future growth. Companies across a wide range of industries, including retail, finance, manufacturing, and industrials, are reporting higher sales per employee and expanding profit margins as AI-enabled automation, robotics, and “distilled” models boost efficiency, particularly in labour-intensive, low-margin sectors. With capital spending accelerating and AI diffusing rapidly via cloud and mobile platforms, the economy may be entering a 1990s-style productivity boom—one that offsets demographic slowdown, supports wage growth, lifts profitability, and acts as a powerful counterweight to geopolitical risk, rising public debt, and macro uncertainty.
Weekly Diversion:
Check out this video: Will we get to see some more magic this Olympics?
Charts of the Week
Equity markets periodically deliver stretches of price action that feel less like a trend and more like a whipsaw, and the recent behaviour of the S&P 500 is a textbook illustration of that dynamic. The chart below, which tracks the index’s spread versus its 50‑day moving average over the last twelve months, visually captures a sequence of sharp swings between “extreme overbought” and “extreme oversold” territory within days. What stands out is not just one abrupt reversal, but a clustering of rapid shifts where readings move from more than one standard deviation above the 50‑day average to more than one standard deviation below, and then back again in remarkably short order. This pattern reinforces the idea that the dominant regime has been one of aggressive mean reversion layered on top of a broader range‑bound market struggling to decisively clear a key price threshold.
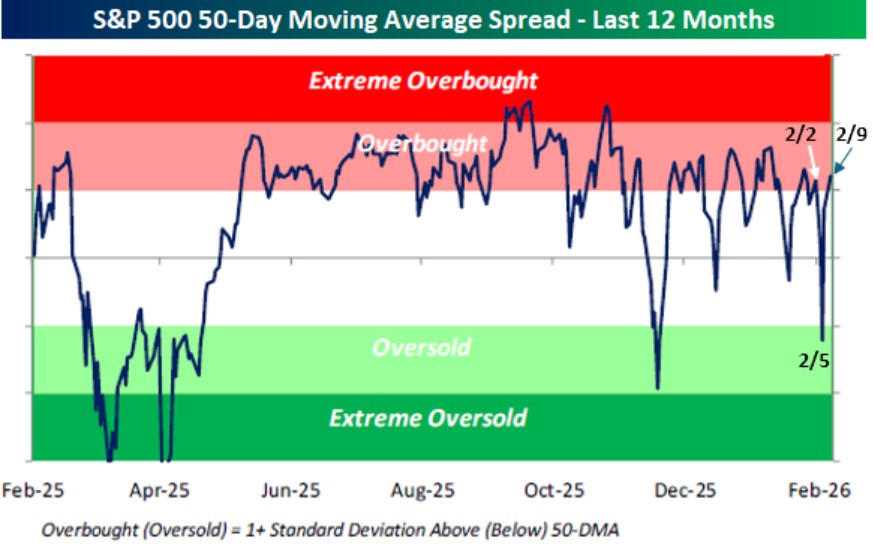
Source: Bespoke Investment Group
The following chart, presenting prior historical episodes when the S&P 500 cycled from overbought to oversold and back to overbought within about two weeks, puts the recent turbulence into long‑term context. Going back to the post‑World War II period, there are only a handful of such occurrences, and yet two of them have appeared in just the last three months, underscoring how unusual the current environment is from a statistical perspective. The forward‑return statistics in the table are even more striking: median gains three, six, and twelve months after these episodes are solidly positive, with a particularly strong median advance over the subsequent year and only one modestly negative outlier. That history suggests that, while the short‑term experience for investors can feel unnerving, prior instances of similar volatility bursts have tended to resolve in favour of upside over intermediate horizons.
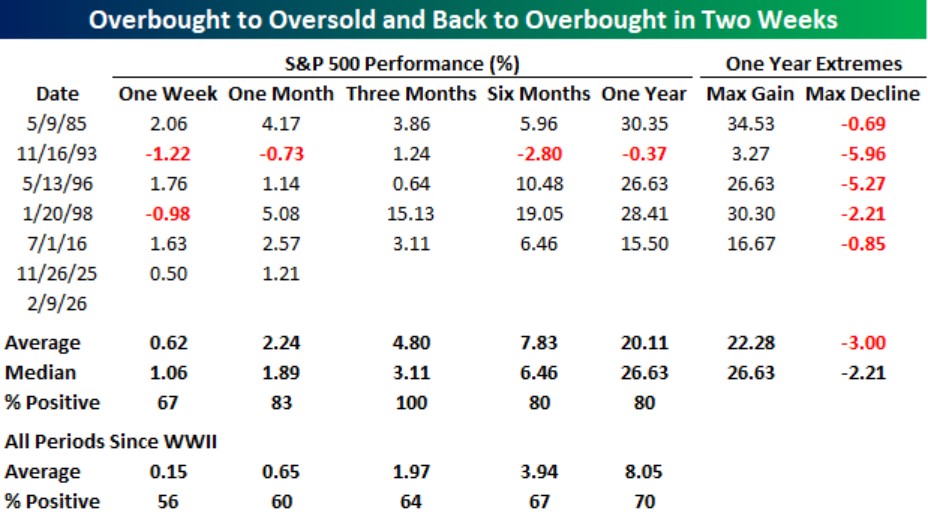
Source: Bespoke Investment Group
Taken together, the two charts tell a coherent story about investor psychology and market structure. The repeated bounces from oversold back to overbought against a backdrop of failed attempts to break meaningfully above a round‑number resistance level hint at an entrenched buy‑the‑dip mentality colliding with valuation or macro‑driven ceiling effects. Each swift downdraft is quickly framed as an opportunity rather than the start of a sustained bear phase, yet each rally runs into familiar resistance, reinforcing the sense of a high‑amplitude trading range rather than a clean trend. For an investor, these charts argue for distinguishing between tactical discomfort and strategic opportunity: episodes that feel like a rollercoaster in real time may, in hindsight, mark consolidation phases within longer bull markets, provided underlying fundamentals do not deteriorate meaningfully.
Sources: Yahoo Finance, First Trust, Advisor Analyst, Financial Post, Bespoke Investment Group
©2026 Milestone Wealth Management Ltd. All rights reserved.
DISCLAIMER: Investing in equities is not guaranteed, values change frequently, and past results are not necessarily an indicator of future performance. Investors cannot invest directly in an index. Index returns do not reflect any fees, expenses, or sales charges. Opinions and estimates are written as of the date of this report and may change without notice. Any commentaries, reports or other content are provided for your information only and are not considered investment advice. Readers should not act on this information without first consulting Milestone, their investment advisor, tax advisor, financial planner, or lawyer. This communication is intended for Canadian residents only and does not constitute as an offer or solicitation by anyone in any jurisdiction in which such an offer is not allowed.