Market Insights: Beneath the Surface
Milestone Wealth Management Ltd. - Feb 06, 2026
Macroeconomic and Market Developments:
- North American markets were mixed this week. In Canada, the S&P/TSX Composite Index closed 1.71% higher, while in the U.S., the Dow Jones Industrial Average rose 2.50% and the S&P 500 Index declined by 0.10%. The reason for the large difference in those two indices is the topic of this week’s Charts of the Week.
- The Canadian Dollar decreased this week, closing at 73.28 cents vs. 73.46 USD last week.
- Oil prices fell this week, with U.S. West Texas Crude closing at US$63.51 vs. US$65.80 last week.
- The price of Gold rose this week closing at US$4,972 vs. US$4,857 last week.
- The United States and Argentina finalized a sweeping trade and investment agreement that sharply cuts tariffs, opens Argentine markets to U.S. exports, and deepens cooperation in energy, critical minerals, technology, and national security. The deal gives U.S. producers preferential access across sectors ranging from autos and pharmaceuticals to agriculture and IT, with Argentina agreeing to recognize U.S. safety and food standards, avoid digital taxes targeting U.S. firms, and prioritize U.S. partners in lithium and copper development—underscoring President Javier Milei’s push toward an open, pro-investment economy and aligning closely with the Trump administration’s trade strategy.
- Canada’s economy is increasingly showing a two-speed problem, with bank economists warning that weak overall growth is being compounded by a deep, long-running recession in manufacturing. Rosenberg Research says Canada is effectively on “recession watch,” noting per-capita GDP is still contracting despite 275 basis points of Bank of Canada rate cuts, with the economy growing at only ~1% and manufacturing and housing down roughly 5% and 2% year over year. That assessment aligns with major bank economists noting that manufacturing has been in recession since mid-2023 — the longest stretch on record — while CIBC Capital Markets economists argue the sector’s decline has been underway for more than two decades due to chronic underinvestment and low capital intensity. In contrast, U.S. manufacturing has surpassed pre-pandemic output as firms aggressively deploy capital, automation, and AI, boosting productivity and profit margins. Canadian manufacturing productivity, meanwhile, has fallen sharply since COVID, widening the competitiveness gap and helping explain why capital and portfolio flows continue to favour the U.S., even as domestic rate cuts struggle to gain traction.
- Energy Minister Tim Hodgson declined to rule out Chinese state-owned enterprises taking majority stakes in Canada’s oil and gas sector, saying all foreign investments would be assessed. The comments followed Prime Minister Mark Carney’s recent trip to China and the signing of a memorandum of understanding aimed at boosting Canadian energy exports and reducing barriers to Chinese investment. While the government framed the approach as pragmatic diversification amid U.S. trade uncertainty, critics argue it signals a dangerous shift on national security and economic sovereignty. Some economists blasted the stance as reckless and tone-deaf; warning Ottawa is opening strategic industries to authoritarian control at the very moment Washington is drawing hard national-security lines. Noting that Carney’s government is mistaking engagement for strategy, drifting away from Canada’s core economic partner, the United States, and exposing the country to long-term vulnerability under Beijing’s “long game.”
- Glencore has suspended nearly $1 billion in planned investments at its Horne Smelter in Quebec after failing to secure regulatory certainty around emissions rules, particularly timelines and arsenic limits set to tighten in 2027. The pause affects Canada’s largest copper metal-producing facility and includes a demobilization plan at the Rouyn-Noranda smelter, along with scaled-back investment at Glencore’s Montreal operations. The company says the situation will need reassessment in coming months if regulatory clarity does not improve. Economists have flagged the decision as a broader warning sign, arguing that unclear and shifting emissions targets, regulatory ambiguity, and “performative” climate policy have replaced economic realism. Especially damaging amid global copper shortages and rising strategic demand and directly contradicting Ottawa’s claims of fast-tracking critical-minerals development under Prime Minister Mark Carney.
- AI’s hype phase is giving way to an ROI reality check as “Magnificent 7” earnings signal a shift from infrastructure build-out to monetization. With combined 2026 Capital Expenditure (CapEx) projected near $660B, investors are now demanding proof that AI spending translates into profits. Alphabet and Meta Platforms are early winners, showing clear payoffs through cloud growth and AI-driven ad efficiency, while Microsoft continues to scale Azure and Copilot amid rising capital intensity. In contrast, hardware leaders like Nvidia face a maturing, more competitive compute market as customers focus on inference efficiency, and Amazon is making a bold bet with record CapEx to defend cloud leadership. The net result is easing market concentration, broader S&P 500 participation, and a clear message: AI is no longer about who spends the most, but who can turn that spend into durable margins and cash flow.
Weekly Diversion:
Check out this video: A little more innovative than my weekend ice fishing
Charts of the Week
Equity market leadership has narrowed markedly in recent years, yet the latest evidence from breadth indicators and relative performance charts suggests a healthier underlying market than headline indices alone would imply lately. On Wednesday, we saw the SPDR S&P 500 ETF (SPY) decline 0.48%, while the Invesco S&P 500 Equal Weight ETF (RSP) gained 0.87%. It was only the 11th occasion since RSP launched in 2003 that SPY dropped more than 0.4% on a day when RSP simultaneously rose more than 0.4%. The data highlights a recurring pattern in which periods of pronounced divergence between market capitalization‑weighted and equal‑weighted representations of the same universe are often followed by well above-average forward returns for both.
The below table, which demonstrates days when the equal‑weight large‑cap ETF (RSP) rallies while its market cap‑weighted counterpart (SPY) declines by more than 0.4% each, shows that these episodes are rare but historically constructive. Across nine prior instances, one‑year returns following such days are positive in every observation for both vehicles, with three‑month, six‑month, and twelve‑month hit rates all skewed strongly to the upside. Average and median outcomes at each horizon cluster firmly in positive territory, suggesting that what can feel like a “leadership crack” at the top of the index has more often coincided with durable strength beneath the surface rather than with imminent broad deterioration.
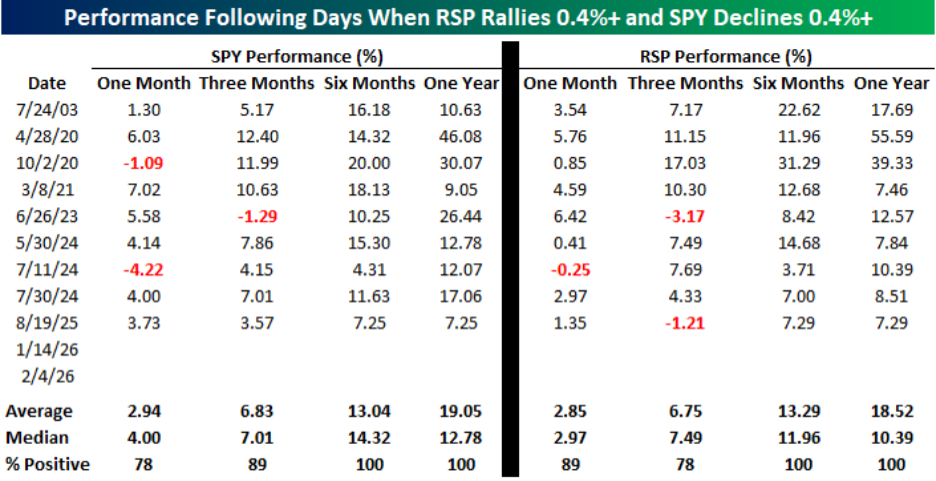
Source: Bespoke Investment Group
That interpretation is reinforced by the chart of the S&P 500’s cumulative advance/decline line over the past year, which has pushed to new highs even as some heavily weighted constituents have come under pressure. A rising A/D line making fresh highs indicates that more stocks are advancing than declining over time, a textbook sign of robust breadth supporting the rally. When the breadth line leads or confirms price, it typically reflects participation that is broadening rather than narrowing, weakening the case for the notion that a handful of mega‑caps are solely propping up the market.
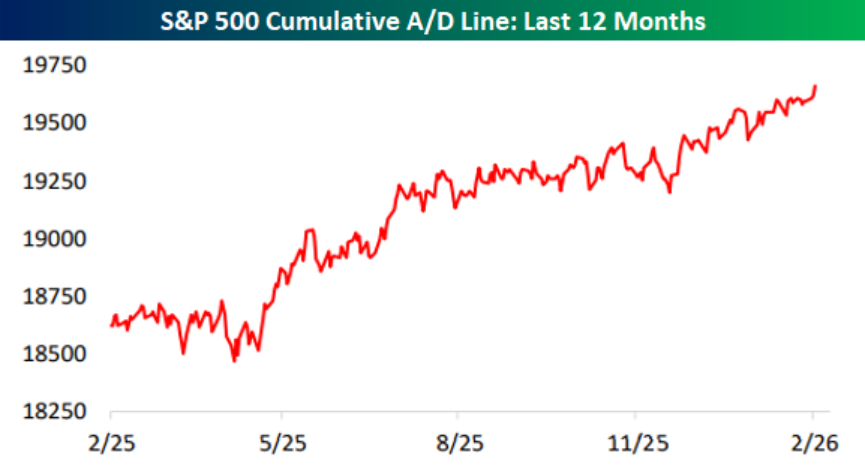
Source: Bespoke Investment Group
The sector‑level bar chart below comparing year‑to‑date returns for equal‑weight and market cap‑weight constructions deepen this picture of broad participation. In seven sectors, the equal‑weight variant is ahead of the market‑cap version this year, with particularly notable relative gains in Technology and Consumer Discretionary, where the equal‑weight lines sit several percentage points above their cap‑weighted peers. While Communication Services and Energy show the opposite—cap‑weighted versions outperforming—the aggregate spread bar for the overall index still favors equal weight, underscoring that performance is not being driven exclusively by the largest names.
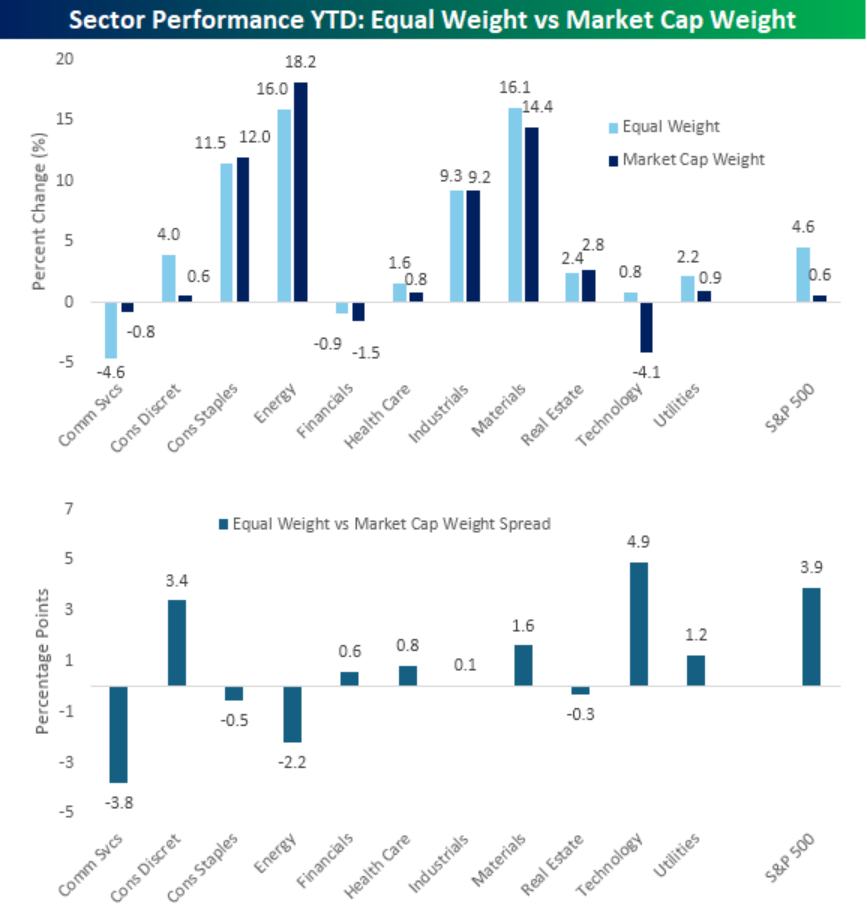
Source: Bespoke Investment Group
The spread chart above, which translates these differences into percentage‑point gaps, makes the rebalancing of leadership visually explicit. Technology’s spread stands out as one of the largest positive bars, indicating that smaller and mid‑sized constituents within that sector have recently outpaced its giants. At the same time, modestly negative spreads in areas like Energy and Communication Services remind investors that this is not a uniform phenomenon, but rather a rotation in which certain sectors see leadership broaden down the size spectrum while others remain top‑heavy.
Taken together, the charts argue against a simplistic “big‑stocks‑are‑cracking, everything‑else‑will‑follow” narrative. Instead, they point to a market phase where current short‑term stress in index heavyweights coexists with improving participation across a wide swath of the index and multiple sectors. For portfolio construction, this backdrop favors paying close attention to equal‑weight benchmarks, sector dispersion, and breadth measures, as they may offer a more nuanced and, at present, more optimistic read on underlying equity market health than market cap‑weighted indices alone.
Sources: Yahoo Finance, First Trust, Fox Business, CTV, BOE Report, Financial Post, Toronto Sun, Market Minute, Bespoke Investment Group
©2026 Milestone Wealth Management Ltd. All rights reserved.
DISCLAIMER: Investing in equities is not guaranteed, values change frequently, and past results are not necessarily an indicator of future performance. Investors cannot invest directly in an index. Index returns do not reflect any fees, expenses, or sales charges. Opinions and estimates are written as of the date of this report and may change without notice. Any commentaries, reports or other content are provided for your information only and are not considered investment advice. Readers should not act on this information without first consulting Milestone, their investment advisor, tax advisor, financial planner, or lawyer. This communication is intended for Canadian residents only and does not constitute as an offer or solicitation by anyone in any jurisdiction in which such an offer is not allowed.