Market Insights: The Santa Rally and First Five Days
Milestone Wealth Management Ltd. - Jan 16, 2026
Macroeconomic and Market Developments:
- North American markets are up to start the year. In Canada, the S&P/TSX Composite Index closed 3.63% higher in the first two full weeks of the year, while in the U.S., the Dow Jones Industrial Average increased 2.02% and the S&P 500 Index rose 1.19% over the first two trading weeks.
- The Canadian dollar decreased over the last two weeks, closing at 71.79 cents USD vs. 72.90 on the January 2nd close.
- Oil prices have risen over the last two weeks, with U.S. West Texas crude closing at US$59.28 vs. US$57.32 on January 2nd.
- The price of gold has jumped in the new year, closing at US$4,588.80 today vs. US$4,314.40 on January 2nd.
- U.S. consumer spending showed renewed momentum in November, with retail sales rising 0.6% (above expectations) and core sales tracking toward a ~3.7% annualized pace in Q4, supporting continued GDP growth. Strength was broad-based, services spending improved meaningfully (restaurants and bars +0.6%), and year-over-year gains remained solid — reinforcing the view that the U.S. consumer continues to provide a durable backbone for the economy.
- U.S. economic growth surged in the third quarter, delivering a strong upside surprise, with real GDP expanding at a 4.3% annualized pace, well above expectations. Growth was broad-based, led by solid consumer spending and a meaningful contribution from net exports, while business investment in equipment and intellectual property continued to strengthen for a third consecutive quarter. Even stripping out more volatile components, “core” GDP — driven by households, businesses, and housing — grew at a healthy 3.0% annual rate, closely in line with the economy’s long-run pre-pandemic trend. Corporate profits also rose sharply, reinforcing the picture of underlying economic momentum, and nominal GDP growth of 8.2% highlights robust demand across the economy. While inflation and interest rates remain important watch points, the Q3 data underscore an economy entering year-end with considerable strength and resilience.
- U.S. inflation pressures at the producer level remain well-contained, with PPI rising a modest 0.2% in November (in line with expectations) and core producer prices unchanged on the month, reinforcing the view that underlying inflation is continuing to cool. While energy prices drove the headline higher, broader trends are constructive: services inflation has moderated meaningfully, goods price pressures have not spilled over into the wider economy, and core PPI has improved from last year’s pace. With money supply growth still subdued and tariff-related inflation fears yet to materialize, the data support a favorable inflation backdrop that preserves flexibility for potential rate cuts later in 2026.
- U.S. inflation closed 2025 on a clearly improving trajectory, with December CPI rising 0.3% as expected and core inflation undershooting forecasts at 0.2%, reinforcing the broader cooling trend beneath the surface. Headline inflation finished the year at 2.7% (down from 2.9% in 2024), while core inflation slowed meaningfully to 2.6% from 3.2% last year, confirming that fears of a tariff-driven inflation resurgence did not materialize. Housing-related inflation — the largest driver of core CPI in recent years — continues to decelerate, real wages remain firmly positive year-over-year, and price declines in areas like used vehicles and communications highlight easing cost pressures.
- U.S. trade data delivered a major upside surprise in October, with the trade deficit narrowing sharply to $29.4B — the smallest monthly gap since 2009 and far better than expectations. The improvement was driven by a strong rebound in exports (+$7.8B) alongside a sizable pullback in imports (-$11.0B), leaving the deficit over $50B smaller than a year ago and pointing to a meaningful boost for real GDP growth. While part of the move reflects volatility in categories like precious metals and pharmaceuticals, the broader picture remains constructive: exports are up 12.1% year-over-year, imports are down 3.6%, the U.S. has now been a net exporter of petroleum for 44 consecutive months, and productivity growth is running well above its long-term trend. Taken together, the data reinforce a narrative of improving trade dynamics, stronger domestic production, and an economy that continues to generate growth momentum even as global trade patterns evolve.
- Canada struck a limited EV trade deal with China, cutting tariffs on up to 49,000 Chinese-made EVs annually in exchange for reduced Chinese tariffs on Canadian agriculture, a move Prime Minister Mark Carney framed as a pragmatic, opportunity-driven partnership. While Ontario Premier Doug Ford and Unifor warned the agreement risks giving heavily subsidized Chinese automakers a foothold in Canada without firm job or investment guarantees, the federal government emphasized that the quota represents less than 3% of annual vehicle sales and mirrors past strategies used to manage foreign auto competition. Some industry experts argue the capped volumes are unlikely to materially impact Canadian production in the near term, though concerns remain that the deal could gradually reshape competitive dynamics in North America’s auto sector.
Weekly Diversion:
Check out this video: Just Like Me at Men’s League
Charts of the Week:
Seasonal patterns and early year signals have long captured investors’ attention, offering a framework for thinking about how the market’s opening stretch might foreshadow the path ahead. The interaction between the first five trading days, the year-end holiday period, and January’s performance provides a rich historical data set that can guide expectations without dictating outcomes.
The first chart highlights the historical annual performance of the S&P 500 Index since 1950 based on the first five trading days. Years that begin on a positive note tend to deliver stronger and more frequent gains than the long-term average, and outcomes improve further when that early strength exceeds a 1% advance as it did this year. When the year starts up over 1% as it did this year (1.1%), it has gone on to produce an average annual return of almost 16% and positive 87% of the time. Against that backdrop, the fact that the new year started with a solid gain supports a constructive bias toward the full-year outlook, even while acknowledging that no single indicator can guarantee results.

Source: Carson Investment Research, FactSet, @ryandetrick
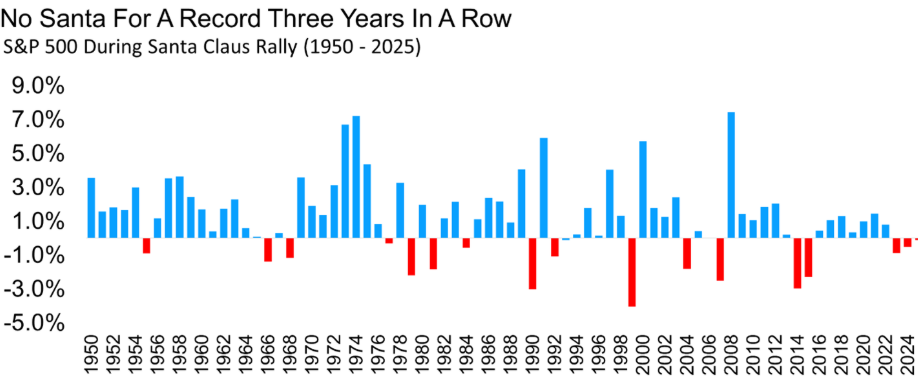
The next chart details historical performance during the Santa Claus Rally window. The recent absence of this seasonal pattern for a record third consecutive year appears unusual but is not automatically bearish for the remainder of the year. The historical record shows that while some past failures of this year-end rally coincided with difficult environments such as 2000 and 2008, other episodes still produced respectable or even strong calendar-year returns, suggesting that this signal is better viewed as a potential early-year turbulence warning than a full year sell signal.
Source: Carson Investment Research, FactSet, @ryandetrick
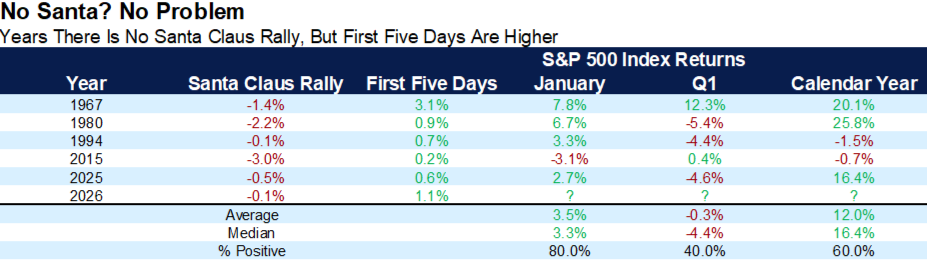
The following table breaks out years when the Santa Claus Rally was negative, but the first five days were positive like this year, and the resulting dispersion of January, first quarter, and full year outcomes underscores the nuance in these seasonal indicators. As we can observe, this combination has historically aligned with choppy or even weak first quarter performance on average, yet full year results have often recovered to deliver mid to high single-digit or double-digit gains, implying that investors who overreact to early year volatility risk missing the longer-term trend.
Source: Carson Investment Research, FactSet, @ryandetrick
*The Santa Claus Rally is the final five trading days of a calendar year and the first two of the following year.
Taken together, the charts argue for a probabilistic, rather than deterministic, use of seasonality in portfolio decisions. While the opening days and seasonal patterns can be valuable context, they are best treated as supporting evidence within a disciplined, long-term investment process rather than as standalone trading signals.
Sources: Yahoo Finance, First Trust, The Canadian Press, Carson Investment Research, FactSet, @ryandetrick
©2026 Milestone Wealth Management Ltd. All rights reserved.
DISCLAIMER: Investing in equities is not guaranteed, values change frequently, and past results are not necessarily an indicator of future performance. Investors cannot invest directly in an index. Index returns do not reflect any fees, expenses, or sales charges. Opinions and estimates are written as of the date of this report and may change without notice. Any commentaries, reports or other content are provided for your information only and are not considered investment advice. Readers should not act on this information without first consulting Milestone, their investment advisor, tax advisor, financial planner, or lawyer. This communication is intended for Canadian residents only and does not constitute as an offer or solicitation by anyone in any jurisdiction in which such an offer is not allowed.