Market Insights: U.S. LNG Exports
Milestone Wealth Management Ltd. - Nov 21, 2025
Macroeconomic and Market Developments:
- North American markets were down this week. In Canada, the S&P/TSX Composite Index closed 0.55% lower. In the U.S., the Dow Jones Industrial Average fell 1.91% and the S&P 500 Index decreased 1.95%.
- The Canadian dollar declined this week, closing at 70.92 cents vs 71.27 cents USD last week.
- Oil prices slipped this week, with U.S. West Texas crude closing at US$57.91 vs US$59.92 last week.
- The price of gold fell slightly this week, closing at US$4,060 vs US$4,088 last week.
- Canada’s inflation slowed to 2.2% in October — helped by a 9.4% drop in gasoline, easing food inflation (3.4% vs. 4% in September), and mortgage costs falling below 3% for the first time in three years — while core measures (CPI-median 2.9%, CPI-trim 3.0%) edged lower, reinforcing expectations that the Bank of Canada will hold its 2.25% policy rate in December despite rent inflation remaining above 5%.
- Canadian retail sales fell 0.7% in September to $69.8B, led by a 3.6% drop in new car sales; six of nine subsectors declined, though core retail (excluding autos & gas) was flat, and food & beverage stores rose 0.8%, while StatCan’s early October estimate points to little change ahead.
- The U.S. trade deficit narrowed to $59.6B in August (vs. $60.4B expected), driven by a sharp $18.4B drop in imports while exports rose slightly—continuing a broader trend of weaker inbound demand, with imports down 1.9% y/y and exports up 1.9%; although the improvement will help Q3 GDP (as real net exports shrink the deficit by $6.3B y/y), the underlying signal is less clear, as softer goods demand and slower hiring in manufacturing raise questions about whether this reflects true reshoring or simply cooling economic momentum; meanwhile, China has fallen to a distant third among U.S. import sources, and the U.S. remained a net petroleum exporter for the 42nd straight month, underscoring the structural shifts underway in global trade flows.
- September’s delayed U.S. jobs report showed a firmer-than-expected labor market, with nonfarm payrolls rising 119,000 (well above the 51,000 consensus) and net gains of 86,000 after revisions, driven by strong hiring in health care and hospitality, while unemployment ticked up to 4.4% as more Americans re-entered the workforce; wage growth eased to 0.2% month-over-month, signaling cooling inflation pressures that support the case for another Fed rate cut in December, though “core payrolls” (excluding government, education/health, and leisure/hospitality) slipped—highlighting underlying softness—and recent jobless claims suggest momentum has begun to fade into October and November.
- Prime Minister Mark Carney ended his UAE trip with a major economic breakthrough, announcing that Ottawa is finalizing a $1-billion project to expand Canada’s critical-minerals processing capacity—aimed at strengthening domestic supply chains, supporting advanced manufacturing, and boosting long-term growth—while securing an estimated US$50 billion (about $70B CAD) in Emirati investment earmarked for Canadian critical minerals, energy infrastructure, ports, and AI innovation; a scale of capital that Carney says reflects renewed global confidence in Canada’s economy and signals a deeper Canada-UAE partnership focused on green technology, industrial development, and doubling bilateral trade within the decade.
Weekly Diversion:
Check out this video: The Dance Floor is Calling!
Charts of the Week:
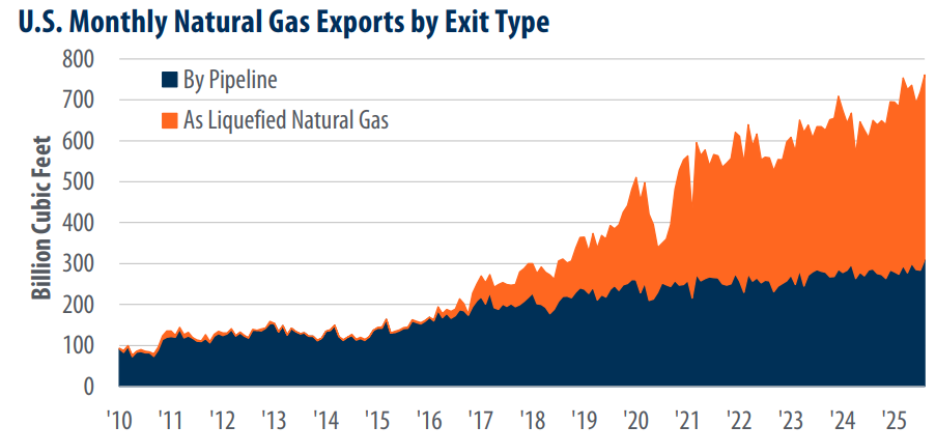
The United States is setting records in natural gas exports, propelled by advanced extraction technologies and a robust energy infrastructure. In 2024, the nation exported a record 21.1 billion cubic feet per day (Bcf/d) of natural gas, both through LNG shipments and pipelines. As of August 2025, exports are already running 13% higher than the same period last year, indicating 2025 will set another all-time high. LNG dominates U.S. export growth, with volumes rising 21.7% year-over-year as of August 2025 and accounting for more than half of all natural gas exports, as this first chart highlights.

Source: U.S. Energy Information Administration, First Trust Advisors
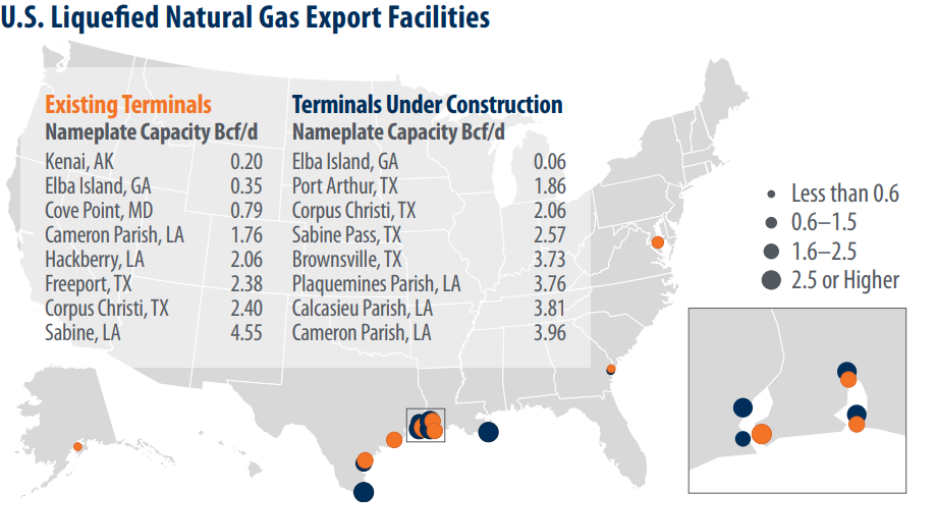
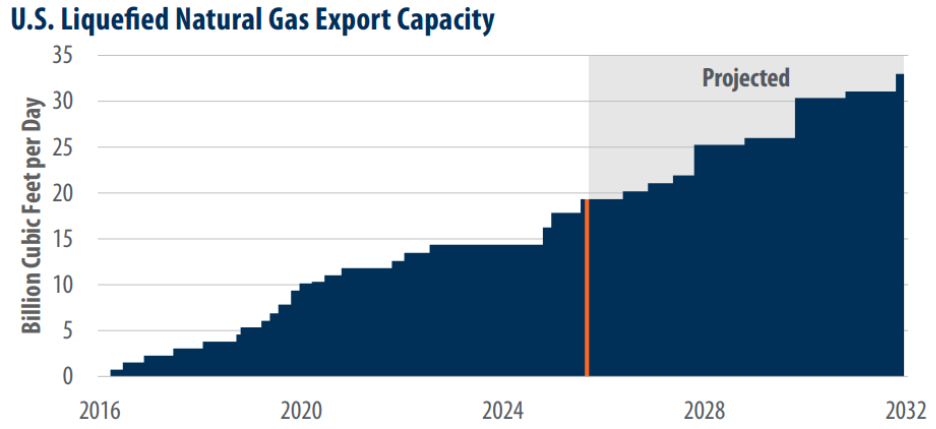
The U.S. currently operates eight major LNG export terminals, mainly clustered along the Gulf Coast in Texas and Louisiana, as the following infographic illustrates. Eight additional terminals are under construction, expected to gradually come online through 2032. Another ten projects have received federal approval but have not yet started construction. Presently, total LNG export capacity stands at about 19.3 Bcf/d. The second charts shows that ongoing investment is slated to add 13.6 Bcf/d of new capacity, which will boost total export potential close to 33 Bcf/d by 2032.

Source: Federal Energy Regulatory Commission, First Trust Advisors

Source: U.S. Energy Information Administration, First Trust Advisors
Exports via pipeline have grown more modestly, with shipments to Canada increasing 1% and those to Mexico rising 3.5% over the past year. Notably, U.S. exports to Mexico are forecasted to grow by nearly 40%, from 6.5 Bcf/d to 9 Bcf/d by 2030. Monthly LNG exports hit consecutive all-time highs in August and September 2025, climbing to 14.8 Bcf/d and 15.1 Bcf/d, respectively—up 8.6% and 11% from the previous highs set in December 2023.
As more export projects come online, the U.S. will reinforce its role as the leading global supplier of LNG and remain crucial to worldwide transitions towards cleaner energy sources. This expansion underlines broader economic impacts and deepens the influence of natural gas in America's energy strategy.
Sources: Yahoo Finance, The Canadian Press, Fox Business, Reuters, First Trust Advisors, U.S. Energy Information Administration, Federal Energy Regulatory Commission
©2025 Milestone Wealth Management Ltd. All rights reserved.
DISCLAIMER: Investing in equities is not guaranteed, values change frequently, and past results are not necessarily an indicator of future performance. Investors cannot invest directly in an index. Index returns do not reflect any fees, expenses, or sales charges. Opinions and estimates are written as of the date of this report and may change without notice. Any commentaries, reports or other content are provided for your information only and are not considered investment advice. Readers should not act on this information without first consulting Milestone, their investment advisor, tax advisor, financial planner, or lawyer. This communication is intended for Canadian residents only and does not constitute as an offer or solicitation by anyone in any jurisdiction in which such an offer is not allowed.