Market Insights: Volatility and the Importance of Staying Invested
Milestone Wealth Management Ltd. - Nov 07, 2025
Macroeconomic and Market Developments:
- North American markets were down this week. In Canada, the S&P/TSX Composite Index closed 1.15% lower. In the U.S., the Dow Jones Industrial Average fell 1.21% and the S&P 500 Index decreased 1.63%.
- The Canadian dollar decreased slightly again this week, closing at 71.22 cents vs 71.30 cents last week.
- Oil prices fell this week, with U.S. West Texas crude closing at US$59.82 vs US$60.89 last week.
- The price of gold was stagnant this week, closing at US$4,013 vs US$4,010 last week.
- In the U.S., the ISM Non-Manufacturing Index rose to 52.4 in October, beating expectations and signaling renewed strength in the U.S. services sector — which accounts for roughly two-thirds of total output. Growth was led by a surge in new orders (56.2) and a rebound in business activity (54.3), while employment (48.2) remained in contraction but showed modest improvement. Despite resilience in demand, inflation pressures persisted as the prices paid index climbed to 70.0, its highest since late 2022. Economists at First Trust noted that service activity has now expanded in ten of the past twelve months, underscoring continued momentum despite tariff uncertainty and the government shutdown. However, firms remain cautious on hiring, and monetary policy remains modestly restrictive, suggesting growth could cool in the months ahead as inflation trends lower.
- Canada’s services sector expanded in October for the first time this year, with the S&P Global Services PMI rising to 50.5 from 46.3 in September, signaling a tentative stabilization after nearly a year of contraction. Analysts said the data suggest businesses are adapting to ongoing economic uncertainty, though growth remains fragile amid weak demand and persistent client hesitancy, especially in export markets hit by the U.S. trade war. Employment continued to edge lower (48.5) as firms avoided replacing departing staff, and business confidence weakened with political and trade uncertainty weighing on sentiment. The broader Composite PMI also rose to 50.3, its highest since late 2024, supported by a slower decline in manufacturing activity.
- Canada’s labour market defied expectations in October, adding 66,600 jobs and pushing the unemployment rate down to 6.9%, its first decline in five months. The gain—driven entirely by part-time positions (+85,000) and concentrated in Ontario’s retail, transportation, and recreation sectors—supports the Bank of Canada’s view that interest rates are now “about right.” Economists at CIBC and Desjardins said the data strengthen the case for the BoC to hold rates steady in December following two consecutive cuts. Still, analysts cautioned that the surge masks underlying softness, with full-time employment down 18,500, and hours worked slipping 0.2% amid strike activity. Wages rose 3.5% year-over-year, though some economists warned that a 9.6% annualized pace of monthly wage growth could re-stoke inflation. Other Economists noted that provincially, Alberta and Ontario are still holding an alarming 7.8% and 7.6% unemployment rate, strengthening the case for further rate cuts.
- Tesla shareholders have approved CEO Elon Musk’s record-breaking $1 trillion pay package, with 75% voting in favor at the company’s annual meeting in Austin, Texas. The compensation plan—the largest in corporate history—would grant Musk up to 12% of Tesla’s stock, worth roughly $1 trillion if the automaker reaches a market capitalization of $8.5 trillion and meets additional performance milestones over the next decade. The proposal follows the voiding of Musk’s previous $56 billion pay package by a Delaware judge in 2024, which remains under appeal. Tesla Chair Robyn Denholm urged shareholders to back the plan, warning that the company could lose Musk’s leadership if it failed. Despite opposition from proxy firms ISS and Glass Lewis and Norway’s sovereign wealth fund, the vote underscores continued investor confidence in Musk’s vision as Tesla pursues dominance in autonomous vehicles and global EV leadership.
- Brookfield Asset Management reported a record US$30 billion in capital raised during the third quarter, marking its strongest fundraising period to date as the firm sees deal activity accelerating across markets. Posting a net income of US$724 million (44 cents per share), up from US$544 million (34 cents) a year earlier, while revenue rose to US$1.25 billion. Brookfield also deployed a record US$23 billion in investments, underscoring confidence in private markets despite broader macro uncertainty. In October, Brookfield and Cameco Corp. announced a strategic partnership with the U.S. government to build nuclear reactors, highlighting the firm’s expanding role in global energy infrastructure and its continued pivot toward long-term, sustainable assets.
Weekly Diversion:
Check out this video: Instant Regret
Charts of the Week:
The year 2025 is illustrated as a hallmark example of market volatility, paralleling numerous years since 1980 that experienced both strong gains and significant corrections. Notably, 2025 saw a near bear market around the Liberation Day crash in April, yet the year still showed potential for solid overall gains. This pattern affirms a recurring theme: good years often include bad days. The chart below illustrates that since 1980, average yearly stock market gains have been double digits, despite average peak-to-trough declines of around 14%. This highlights that corrections of 12-15% are normal and should be expected.
Source: Carson Investment Research, YCharts, @ryandetrick
Further analysis shows that the worst market days typically occur near the best days, which means selling during downturns often results in missing out on subsequent rallies. For instance, the significant two-day selloff after Liberation Day in 2025 was quickly followed by one of the best two-day rallies. This is supported by the table below listing years when the S&P 500 gained 20% or more but still had severe down days, such as 1997, when the market dropped nearly 7% on its worst day but ended the year with a 30.9% gain. This reinforces the advice for investors to expect volatility and stay the course without panicking.
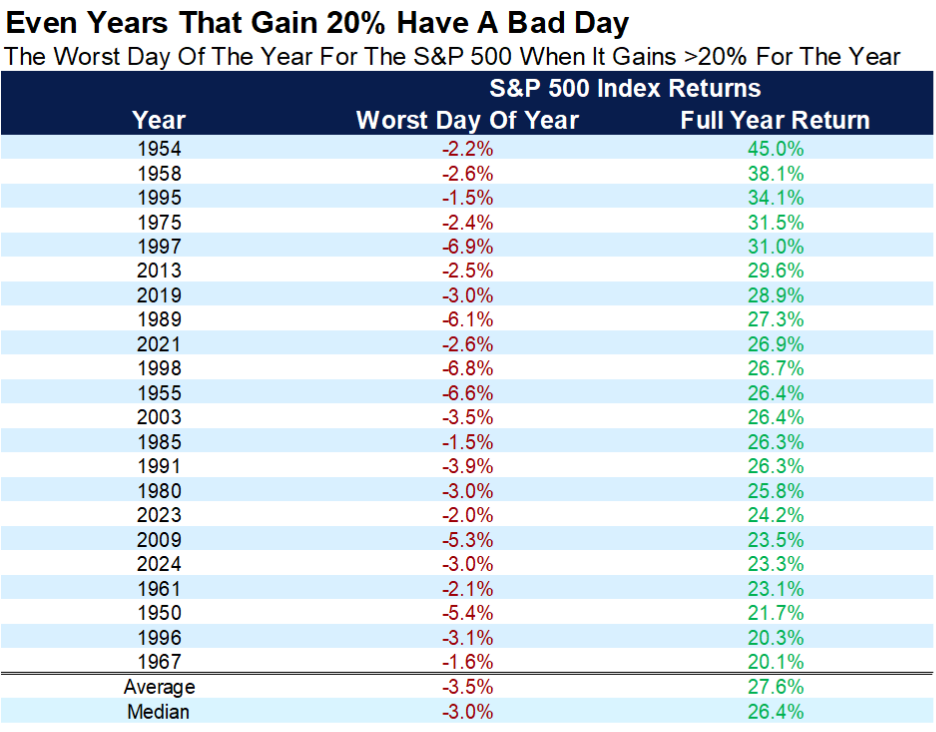
Source: Carson Investment Research, FactSet, @ryandetrick
One of the most striking charts below quantifies the penalty for missing the best 10 market days within a year. The chart highlights the returns (black bars) from 2000 to 2024, as well as the returns by year when missing the 10 best performing days (blue bars). The chart also shows the average yearly return of the S&P 500 since 1990 at just under 10%. However, if an investor missed the top 10 positive days per year, the return would plummet to about -12.7%. This serves as a powerful reminder to not time the market but rather to maintain consistent investment discipline through volatile periods.
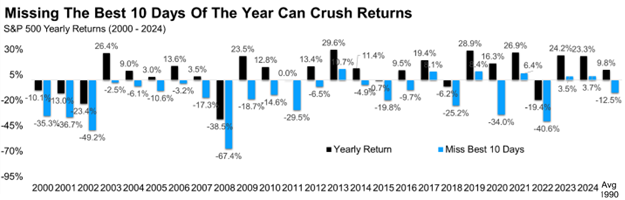
Source: Carson Investment Research, YCharts, @ryandetrick
Finally, 2025 is positioned as a potential "slingshot" year, where despite falling over 15% during the year, it still closed with double-digit gains. Historically, years like 1982, 2009, and 2020 that exhibited this pattern were followed by strong gains in the subsequent year, around 19% on average. This offers a bullish outlook for 2026, illustrating how volatility and corrections can set the stage for future momentum.
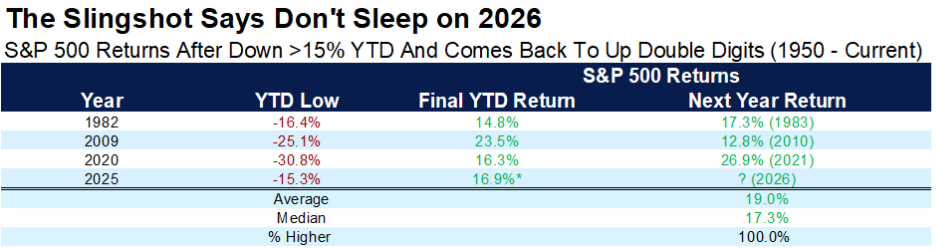
Source: Carson Investment Research, FactSet, @ryandetrick
In summary, charts and commentary collectively reinforce that volatility, while uncomfortable, is a normal and necessary feature of the investment landscape. The key message for investors is to expect volatility, avoid panic selling, and maintain a long-term focus to benefit from the market’s overall upward trajectory.
Sources: Yahoo Finance, First Trust, The Canadian Press, Fox Business, Reuters, Statistics Canada, Carson Investment Research, Factset, @ryandetrick
©2025 Milestone Wealth Management Ltd. All rights reserved.
DISCLAIMER: Investing in equities is not guaranteed, values change frequently, and past results are not necessarily an indicator of future performance. Investors cannot invest directly in an index. Index returns do not reflect any fees, expenses, or sales charges. Opinions and estimates are written as of the date of this report and may change without notice. Any commentaries, reports or other content are provided for your information only and are not considered investment advice. Readers should not act on this information without first consulting Milestone, their investment advisor, tax advisor, financial planner, or lawyer. This communication is intended for Canadian residents only and does not constitute as an offer or solicitation by anyone in any jurisdiction in which such an offer is not allowed.