Market Insights: Third Quarter Wrap-up
Milestone Wealth Management Ltd. - Oct 03, 2025

2025 Third Quarter Wrap-up
Key Updates on the Economy & Markets
Markets carried their strong momentum from Q2 into Q3, with the S&P/TSX Composite, S&P 500, Nasdaq, and small-cap stocks each hitting new all-time highs. Investor sentiment remained optimistic despite soft labor market data and mixed economic signals, and stocks traded higher due to strong corporate earnings, the U.S. Federal Reserve’s pivot toward rate cuts, and easing trade tensions. The technology sector remained an important contributor, as artificial intelligence (AI) companies reported strong earnings growth. At the same time, improving market breadth added fuel to the rally, and small-cap stocks finally broke above their 2021 highs. In this letter, we recap Q3’s defining themes, review stock and bond market performance, and look ahead to the final quarter of 2025.
A Quarter of Transition in the Economy
The quarter opened on solid footing. Economic activity had recovered from the tariff-driven volatility earlier in the year, and incoming data pointed to steady consumer and business demand. Job growth was solid, consumers continued to spend, and business surveys showed sentiment was improving. Stock markets traded higher in July, driven by confidence that the U.S. economy could withstand high interest rates and trade uncertainty without slipping into a recession.
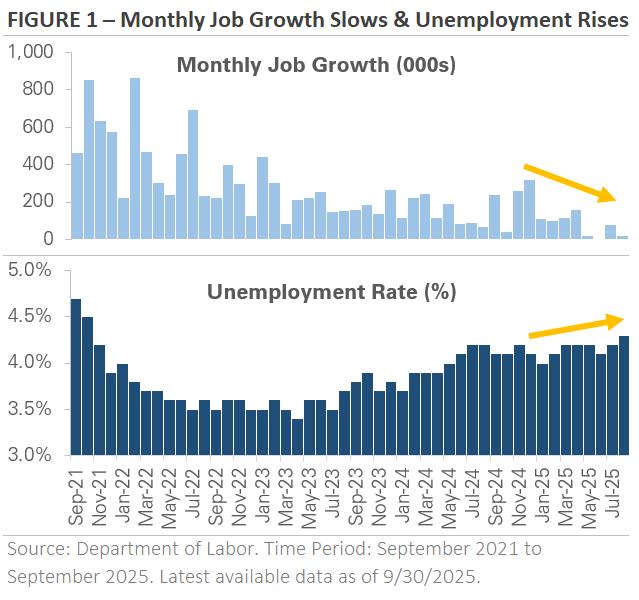
By late summer, cracks began to emerge in the U.S. labor market. Figure 1 shows job growth slowed sharply starting in May, with two consecutive months of weak job growth in July and August and negative revisions to prior months. The U.S. unemployment rate rose to 4.3%, the highest since 2021. While the labor data raised concerns about an economic slowdown, separate data showed consumer spending remained solid. Economic growth was still positive, but the economy was softening.
The shift in the economic backdrop was significant because it changed the conversation around Federal Reserve (Fed) policy. As labor market data softened, the market adjusted its forecast to price in a more accommodative Fed and multiple interest rate cuts before year-end. In the market’s view, slowing job growth wasn’t a recession signal but rather a catalyst for the Fed to resume its rate-cutting cycle. The question was when, not if, the Fed would deliver its next cut.
Fed Cuts Interest Rates After a 9-Month Pause
The Fed held interest rates steady at its late-July meeting, citing a solid labor market and lingering inflation risk. However, the outlook changed two days later when the July jobs report missed expectations. In his Jackson Hole speech a few weeks later, Fed Chair Jerome Powell laid the groundwork for a September rate cut. He noted that monetary policy appeared restrictive and said softening labor market data might justify a rate cut, despite inflation still above target. Powell’s remarks reinforced expectations for a September cut and marked a clear shift from fighting inflation to supporting the labor market.
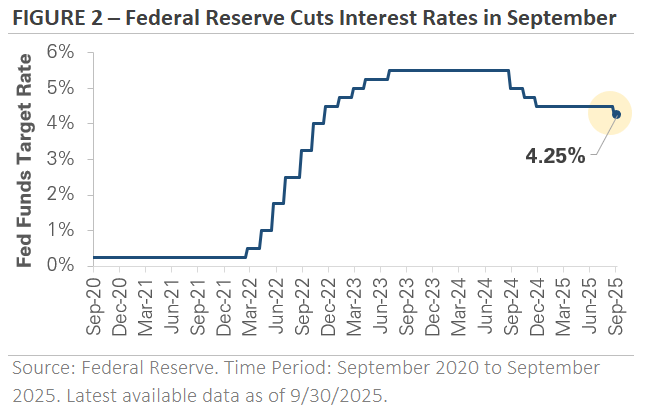
As expected, the Fed delivered a 0.25% rate cut in September, ending its nine-month pause (see Figure 2). In his press conference, Fed Chair Powell framed the move as a “risk management” cut, describing it as a proactive step to keep the economic expansion on track rather than concern about a recession. The central bank updated its policy forecast to include two more rate cuts before year-end, with the potential for more in 2026. The revised forecast and Powell’s remarks signaled a measured and gradual rate-cutting cycle rather than an aggressive one.
The market initially celebrated the Fed’s decision, with stocks climbing to record highs and interest-rate-sensitive sectors outperforming. However, sentiment cooled in late September after a batch of stronger-than-expected data suggested the economy may need fewer rate cuts, with Q2 U.S. GDP growth being revised higher and consumer spending remaining solid. The data caused investors to dial back their rate cut expectations, and by quarter-end, the market was pricing in a slower pace of cuts.
The Bank of Canada followed suit in September, cutting its own benchmark interest rate from 2.75% to 2.5% ending a six-month pause. Our rate has now halved since it peaked at 5% in 2023/24, and there is the expectation for one to two more quarter point cuts this year with our economy on softer footing than down south.
Artificial Intelligence Theme Dominates Headlines
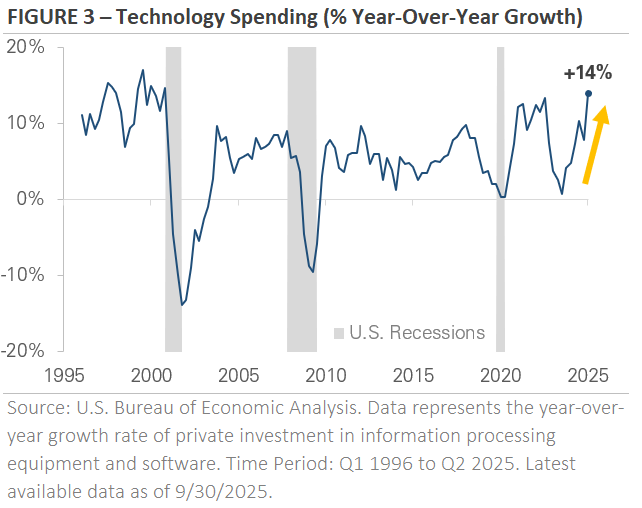
Artificial intelligence continued to be a top market theme during the quarter. Figure 3 shows technology-related investment grew 14% year-over-year in Q2, the second consecutive quarter and the fastest pace since the late 1990s. The spending is tied to the AI industry buildout, with billions being spent on high-performance computer chips, cloud architecture, data center construction, and the power and cooling needed to run it all. The spending boom has become a significant contributor to U.S. economic growth and helped offset softness in rate-sensitive areas, such as housing, manufacturing, and non-AI business investment.
Management teams across the AI supply chain continue to report strong demand. Spending plans measure in the hundreds of billions, and order backlogs span years, not quarters, into the future. The commentary and scale of investment reinforce the market’s belief that AI will drive capex budgets in the coming years, and investors see AI infrastructure spending as a durable theme with room for growth. In the equity market, AI enthusiasm has fueled outsized gains in specific technology and semiconductor stocks, creating a wide divide between AI-infrastructure leaders and the broader market.
While investors view AI as a multi-year investment cycle rather than a one-off spending burst, a more balanced conversation around AI is also taking place. Some question whether spending is outpacing potential revenue growth, and early studies have questioned whether the productivity gains from the new technology justify the high level of investment. These concerns have triggered periodic volatility, but they haven’t derailed the broader narrative that AI will continue to be a key driver of corporate earnings growth, economic growth, and market returns.
Materials Index Dominates Canadian Stock Market
Our market has had its own dominant force, driving over 40% of the S&P/TSX Composite’s return this year. The S&P/TSX Capped Materials Index has skyrocketed up 79.3% YTD total return through September, displacing the TSX Energy sector as the second largest component of S&P/TSX Composite Index (Financials remain the largest). This surge has primarily been driven by a significant rally in gold prices, reaching an all-time high above $3,800 USD an ounce, boosting precious metals producers. Other contributors have been persistent global economic uncertainty and geopolitical risks, as well as sustained central bank purchases and anticipation of further rate cuts making non-yield-bearing haven assets like gold more attractive.
Equity Market Recap – Stocks Rally to New Highs as Market Leadership Broadens
Stocks climbed to new highs in Q3, boosted by the Fed’s rate cut, resilient earnings, and continued enthusiasm around AI. The Fed’s rate cut marked a shift toward policy support and fueled optimism for a “soft landing,” a scenario whereby the economy slows but avoids a recession. Trade policy was another tailwind, and progress on deals with major trading partners reduced the near-term risk of escalation.
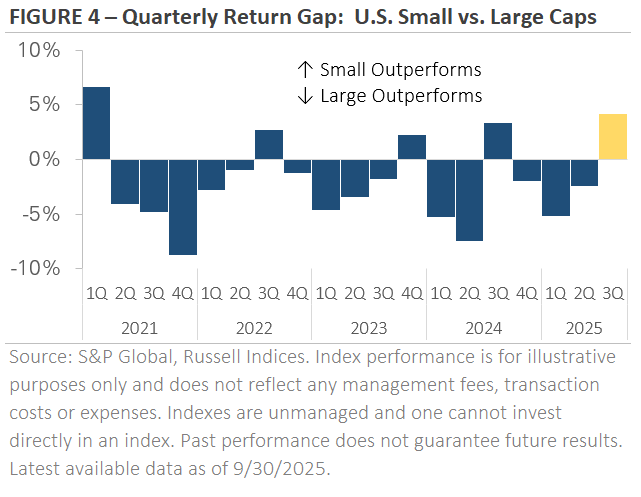
The S&P 500 gained more than 8% in Q3, bringing its year-to-date return to over 14%. Technology stocks remained a key driver, but broader market leadership also provided a tailwind. Small-cap stocks rallied sharply in anticipation of the Fed’s rate cut. The Russell 2000 surpassed its previous high from 2021 and returned nearly 12% as investors bet that rate cuts would benefit smaller companies. Figure 4 shows small caps posted their biggest quarter of outperformance over the S&P 500 since Q1 2021. In another sign of the market’s optimism, cyclical sectors broadly outperformed their defensive counterparts.
In Canada, the S&P/TSX Composite returned another 12.5% in Q3 for a strong 23.9% total return so far this year, while the S&P/TSX Small Cap Index has now gained a whopping 36.3%. As we described, a significant part of this overall advance has come from the Materials Index. However, it is worth nothing that the S&P/TSX Capped Financials Index (Canada’s largest sector) has returned 22.5% YTD, a strong number in its own right.
International stocks performed in line with the S&P 500 in Q3, but headline results masked significant divergence beneath the surface. Emerging markets outperformed U.S. stocks, driven by renewed stimulus efforts in China and strong gains from AI-related companies in Asia. The Fed’s decision to resume its rate-cutting cycle provided another tailwind, as emerging markets—like U.S. small caps—are often viewed as more sensitive to rate cuts and shifts in global financial conditions. In contrast, developed markets underperformed U.S. stocks. European equities ended the quarter modestly higher as they consolidated gains from earlier this year. Despite the quarter’s mixed returns, both emerging and developed markets have gained more than 25% year-to-date in USD. The two indices are each outperforming the S&P 500 by more than 10% since the start of 2025.
Credit Market Recap – Bonds Trade Higher as the Fed Resumes Its Rate-Cutting Cycle
Interest rates fluctuated in Q3 but ended the quarter lower. Treasury yields rose in July as stronger-than-expected economic data pushed back the expected timing of Fed rate cuts. However, yields reversed sharply lower in August after the soft labor market data and Chair Powell’s speech. Treasury yields declined further in early September after the weak August jobs report, but they ticked higher later in the month as economic data stabilized.
The decline in Treasury yields caused bonds to trade higher. Longer-maturity bonds outperformed due to their higher sensitivity to falling interest rates, while shorter-maturity bonds underperformed. This outperformance extended to corporate bonds, where investment-grade outperformed high-yield as the combination of falling interest rates and credit spread tightening produced gains. Performance for Canadian bonds has been weaker, as our long-term rates started the year much lower than in the U.S. The S&P Canada Aggregate Bond Index advanced 1.33% in Q3 and has now gained just 2.79% YTD, while the S&P U.S. Aggregate Bond Index has returned 5.96%.
Corporate credit spreads remain tight by historical standards. Investment-grade and high-yield spreads are at their tightest levels in decades, a reflection of investor confidence in corporate earnings growth and the economic outlook. While spread tightening has supported corporate bond returns recently, it means valuations are no longer cheap. Corporate bonds offer compelling yields for income-focused investors, but they also come with important trade-offs. When credit spreads are this tight, there’s less margin of safety if earnings or economic growth disappoint. If either of these scenarios occur, Treasury bonds could outperform corporate bonds despite their lower yields.
Q4 Outlook – Navigating a Busy End to the Year
The outlook for the economy is constructive heading into Q4, although the path may be uneven. Growth appears to be moderating, with softer labor market data offset by solid consumer spending. Investors will be watching closely to see whether the slowdown remains orderly or turns into something more disruptive. For now, the market views a “soft landing” as the base case, where the economy cools enough to ease inflation pressures without causing a recession. A sharp drop in either job growth or consumer spending would challenge the soft-landing narrative that pushed the stock market to new all-time highs in Q3.
Federal Reserve policy will likely dominate headlines again in Q4. The Fed’s September rate cut ended its 9-month pause, but policymakers have signaled a gradual easing cycle rather than an aggressive one. The market forecasts two more cuts by year-end, though this outlook could shift if inflation reaccelerates or the labor market stabilizes. In that sense, Q4 is set up to be a very data-dependent quarter, with jobs, inflation, and consumer spending data all impacting the market and economic outlook.
Corporate earnings will be another area of focus. Earnings have proven surprisingly resilient this year, with Q2 earnings season producing solid growth and a high beat rate despite tariff volatility and policy uncertainty. The Q3 earnings season begins in mid-October, and management guidance will be key as companies update investors on the impact of tariffs and their 2026 outlooks. Profit margins are likely to remain under scrutiny due to tariffs, economic uncertainty, and supply chain challenges. Earnings growth is expected to remain positive in Q4, though the pace may moderate.
AI-related capital investment remains a major theme. Companies are reporting unfilled orders stretching into 2026 and capex plans measuring in the hundreds of billions, reinforcing the view that AI will be a multi-year investment cycle. However, valuations for AI companies are expensive, and much of the backlogs and spending plans are widely known and already reflected in stock prices. An earnings disappointment or skepticism around AI’s economics could weigh on the technology sector’s leadership and, by extension, the broader equity market.
It's been a busy year for markets, and Q4 is shaping up to be no different. Our team is watching the data and policy developments closely as we help clients stay positioned for the coming quarters. The market’s recent strong advance and the steep and sharp correction in February-April earlier this year, are a good reminder that investing is a marathon, not a sprint.
Thank you for your continued trust in Milestone and for the opportunity to assist you in working toward your financial goals. We understand the risks and opportunities facing the markets and the economy and are committed to helping you effectively navigate all investment environments by maintaining a globally diversified portfolio designed to weather the market’s swings, aligned with your long-term goals. Market volatility can be unsettling, but it’s a normal part of investing. Therefore, it’s critical to stay invested, remain patient, and stick to the plan, as we’ve collaborated with you to establish a unique, personal allocation target based on your financial position, risk tolerance, and investment timeline.
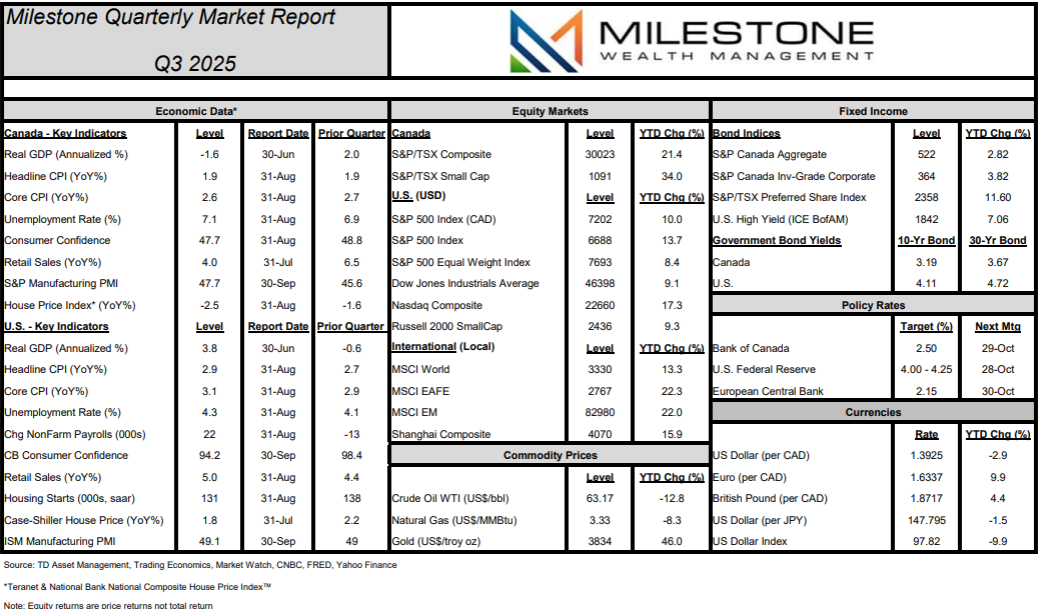
Here is our Milestone Quarterly Market Report on economic data, capital markets, commodities, and currencies through September 30th, 2025: *Click here for PDF version*
Disclosure:
Investing in equities is not guaranteed, values change frequently, and past performance is not necessarily an indicator of future performance. Investors cannot invest directly in an index. Index returns do not reflect any fees, expenses, or sales charges. Opinions and estimates are written as of the date of this report and may change without notice. Any commentaries, reports or other content are provided for your information only and are not considered investment advice. Readers should not act on this information without first consulting Milestone, their investment advisor, tax advisor, financial planner, or lawyer. This communication is intended for Canadian residents only and does not constitute as an offer or solicitation by anyone in any jurisdiction in which such an offer is not allowed.
Sources: Bloomberg, Barchart, TD Asset Management, Trading Economics, Teranet & National Bank of Canada, Barchart, MarketDesk Research LLC, S&P Global, Russell Indices, MSCI, U.S. Department of Labor, U.S. Federal Reserve, U.S. Bureau of Economic Analysis
©2025 Milestone Wealth Management Ltd. All rights reserved.