Market Insights: Electric Vehicle Adoption
Milestone Wealth Management Ltd. - Sep 05, 2025
Macroeconomic and Market Developments:
- North American markets were mixed this week. In Canada, the S&P/TSX Composite Index closed 2.17% higher. In the U.S., the Dow Jones Industrial Average fell 0.52% this week & the S&P 500 Index decreased 0.31%.
- The Canadian dollar decreased slightly, closing at 72.22 cents vs 72.76 cents last week.
- Oil prices dropped this week, with U.S. West Texas crude closing at US$62.04 vs US$63.98 last week.
- The price of gold jumped again this week, closing at an all-time high US$3,647 vs US$3,516 last week.
- The US services sector once again proved resilient in August, with the ISM Non-Manufacturing Index rising to 52.0 — the strongest reading in six months and above expectations — as growth was broad-based across 12 of 18 industries; new orders jumped to a 10-month high (56.0) and business activity to a five-month high (55.0), though employment remained a weak spot (46.5, signaling contraction for the fifth time in six months).
- U.S. nonfarm payrolls rose just 22,000 in August (vs. 77,000 expected), with prior months revised down, leaving a net gain of only 1,000; while health care added 47,000 jobs, manufacturing (−12,000) and government (−16,000) weakened, pushing unemployment up to 4.3%; average hourly earnings rose 0.3% m/m (3.7% y/y), underscoring a cooling labor market that, alongside stricter immigration enforcement and trade uncertainty, is fueling expectations the Fed will resume rate cuts this month.
- Canada’s unemployment rate climbed to 7.1% in August — the highest since 2016 outside of pandemic years — as the economy shed 65,500 jobs, with losses concentrated in services (−67,200), manufacturing (−19,200), and transportation (−22,700), reflecting the drag from U.S. tariffs and weaker business confidence; while wages grew 3.6% year-over-year, the weak jobs data pushed market odds of a Bank of Canada rate cut on September 17 to over 90%.
- China extended its anti-dumping probe into Canadian canola imports by six months (to March 2026), keeping steep preliminary duties of 75.8% on canola seed in place and heightening trade tensions; the move buys time for potential negotiations, as Ottawa seeks to preserve its U.S. trade ties while China signals interest in shifting supply to Australia, a risk for Canada’s C$5 billion export industry that relies heavily on Chinese demand. Prime Minister Mark Carney unveiled a $370M incentive package to support Canada’s canola sector, including new biofuel production incentives, amended Clean Fuel Regulations, expanded interest-free advances, and funding for market diversification.
- Strathcona Resources lifted its stake in MEG Energy to the maximum 14.2% allowed under takeover rules, aiming to block Cenovus Energy’s board-backed bid that requires two-thirds shareholder approval; the move raises the bar for Cenovus to about 78% support from remaining investors, intensifying a high-stakes battle where Strathcona positions itself as the bold upstart challenger to Cenovus’ more traditional cash-heavy “white knight” offer, with both sides lobbying shareholders ahead of the October 9 vote.
- Tesla’s board proposed a record $1 trillion pay package for CEO Elon Musk — nearly 18x his contested 2018 plan and close to Tesla’s current market value — tying the award to ambitious goals of reaching an $8.6 trillion valuation and milestones like mass production of robotaxis and humanoid robots; while the board argues the plan is essential to keep Musk focused as Tesla pivots to AI and robotics, critics warn of governance risks, dilution, and Musk’s political distractions, yet the sheer scale underscores both his influence and the board’s confidence in his leadership.
Weekly Diversion:
Check out this video: Romanian Gift to Canada
Charts of the Week:
The global electric vehicle (EV) market, has entered a phase of unprecedented expansion, with sales and adoption accelerating across continents, though with striking regional diversity. As of 2024, over 17 million EVs were sold worldwide, and projections for 2025 suggest sales will surpass 20 million units, marking a significant milestone: nearly one in four new cars sold this year will be electric.
By the end of 2024, almost 60 million EVs were on the road globally, making up about 4.5% of the world’s total vehicle fleet. While absolute adoption rates lag behind in most countries, limited infrastructure and policy support remain key hurdles. China stands at the forefront, as shown in the chart below, not just in sheer numbers but also infrastructure development. By the end of 2024, China had 34 million EVs—about 11% of its total vehicles—making it a clear leader in both adoption and absolute numbers. This dominance comes despite rapid growth rates in other regions, such as Europe, which boasts 14.1 million EVs (4.7% of its fleet), and the United States, where the number reached 6.3 million (2.7% of fleet).
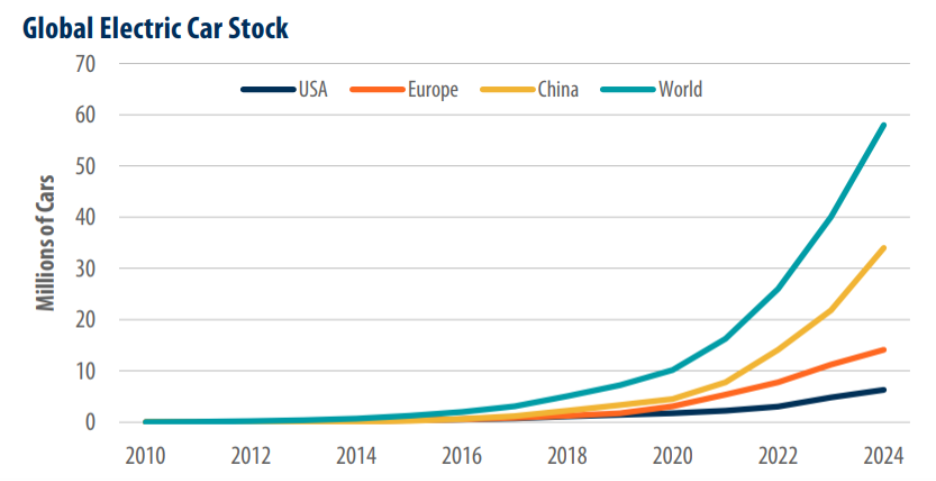
Source: International Energy Agency, First Trust Advisors
The Norwegian experience stands out globally. In 2024, Norway claimed an extraordinary 92% of new car sales as electric, as shown in the chart below, and 32% of all vehicles on the road are now electric—by far the world’s highest share. Norway’s achievement is due to a combination of robust policy incentives—including exemption from high purchase and value-added taxes—and heavy investment in charging infrastructure. The nation's nearly 35,000 charging stations for just 5.5 million people, backed by renewable grid power, offer a vision of a fully electrified future. Norway serves as a case study in how comprehensive incentives and infrastructure can transform adoption, yet few countries are positioned to replicate its model due to demographic, economic, and technological differences.
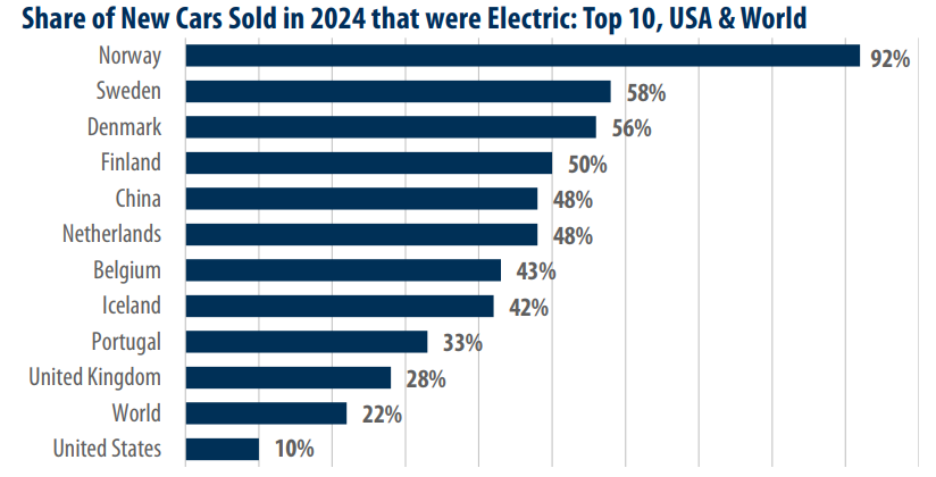
Source: International Energy Agency, First Trust Advisors, Data year 2024
A key challenge remains the infrastructure gap, especially the ratio of vehicles to public charging points. The chart below shows the global stock of charging points by year by region. From 2018 to 2024, China increased its charging points by 1,179%, yet its EV fleet grew even faster at 1,418%. Similar disparities exist in Europe and the U.S., with the U.S. ratio of EVs per charger rising from 19 in 2018 to nearly 32 by 2024. Inadequate charging infrastructure risks becoming a bottleneck for further EV adoption, particularly outside pioneering markets.
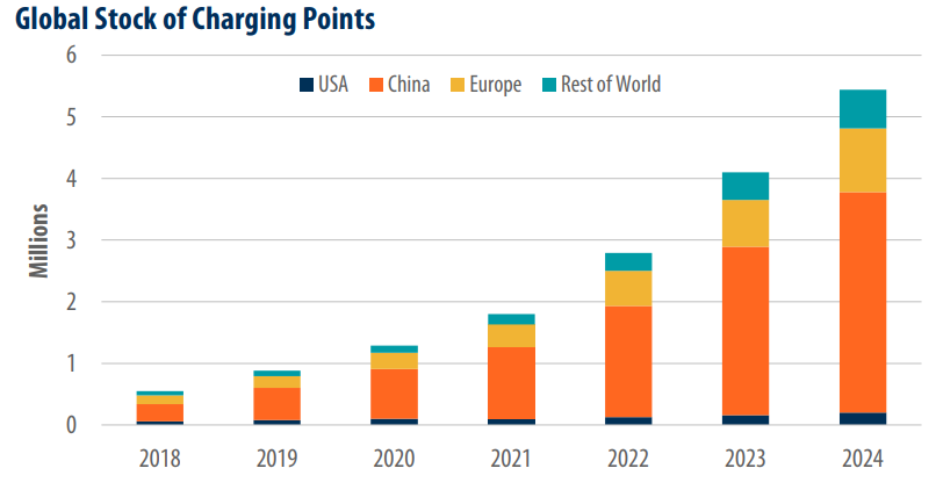
Source: International Energy Agency, First Trust Advisors
The rise of electric vehicles is fundamentally reshaping the global automotive landscape, but the path differs markedly by region, driven by local policy, infrastructure investment, and market forces. China and Norway provide contrasting yet instructive models of rapid EV transformation. With momentum accelerating, the coming years will test whether the rest of the world can overcome infrastructure and policy barriers to achieve similar breakthroughs.
Sources: Yahoo Finance, Reuters, The Canadian Press, The Financial Post, Bespoke Investment Group, First Trust
©2025 Milestone Wealth Management Ltd. All rights reserved.
DISCLAIMER: Investing in equities is not guaranteed, values change frequently, and past results are not necessarily an indicator of future performance. Investors cannot invest directly in an index. Index returns do not reflect any fees, expenses, or sales charges. Opinions and estimates are written as of the date of this report and may change without notice. Any commentaries, reports or other content are provided for your information only and are not considered investment advice. Readers should not act on this information without first consulting Milestone, their investment advisor, tax advisor, financial planner, or lawyer. This communication is intended for Canadian residents only and does not constitute as an offer or solicitation by anyone in any jurisdiction in which such an offer is not allowed.