Market Insights: Strong Performance for Small Caps
Milestone Wealth Management Ltd. - Aug 29, 2025
Macroeconomic and Market Developments:
- North American markets were mixed this week. In Canada, the S&P/TSX Composite Index closed 0.82% higher. In the U.S., the Dow Jones Industrial Average fell 0.19% and the S&P 500 Index declined by 0.10%.
- The Canadian dollar rose slightly, closing at 72.76 cents vs 72.28 cents USD last week.
- Oil prices were steady again this week, with U.S. West Texas crude closing at US$63.98 vs US$63.79 last week.
- The price of gold jumped this week, closing at US$3,516 vs US$3,417 last week.
- In the U.S., personal income rose 0.4% in July, led by a strong 0.7% increase in private-sector wages and salaries, while spending climbed 0.5% with broad-based gains across goods and services. Inflation, measured by the Fed’s preferred Personal Consumption Expenditures (PCE) index, remained stable at 2.6% year-over-year, showing no acceleration despite tariffs. Real consumption advanced 0.3%, up 2.1% from last year. With steady inflation and soft manufacturing data, markets widely expect the Fed to begin cutting rates at its September meeting, with a second cut likely before year-end.
- Q2 U.S. GDP was revised up to a 3.3% annualized rate (vs. 3.1% expected) from the first estimate of 3.0%, with stronger consumer spending and business investment offsetting weaker government spending and trade. “Core” GDP — consumer spending, business fixed investment, and housing — improved to 1.9% from 1.2%. Corporate profits rose 1.7% in Q2 and 3.2% year-over-year, though that marks the slowest annual growth since 2020. The GDP price index held at 2.0%, keeping year-over-year inflation at 2.5%.
- Canada’s economy shrank at a 1.6% annualized rate in Q2 after a 2.2% annualized increase in Q1, the steepest drop in seven quarters, as U.S. tariffs drove exports down 7.5%, the largest decline in five years. Business investment also weakened, while domestic demand provided some cushion with strong household (+4.5%), residential (+6.3%), and government spending (+5.1%). The deeper-than-expected contraction has money markets pricing in roughly 50/50 odds of a Bank of Canada rate cut on Sept. 17, though officials are watching upcoming jobs and inflation data closely.
- Fresh data from Statistics Canada’s payroll survey (SEPH) showed a 32,500-job loss in June, pushing CIBC to say the odds of a September Bank of Canada cut are now 50-50. Weakness is showing up in non-tariff-sensitive sectors like retail, construction, and health care, adding to losses in manufacturing tied to U.S. tariffs. While the broader job market has been volatile, analysts say the big picture points to rising slack, with the jobless rate at 6.9%. The BoC is watching closely for spillovers beyond trade-sensitive sectors before moving on rates.
- Ottawa reported a $3.3B deficit for April–June, slightly wider than last year’s $2.9B shortfall. Revenues rose 2.9% on higher counter-tariff, corporate, and personal tax receipts, but program expenses climbed 4.6%. Debt charges eased marginally as lower bill rates were offset by higher bond costs.
Weekly Diversion:
Check out this video: Hidden in the rough
Charts of the Week:
Last Friday, the Russell 2000, the widely followed U.S. small-cap index, saw an impressive performance with 96% of the stocks represented in the index finishing the day higher. When a vast majority of constituents in a small-cap index rise concurrently in a single session, it typically represents an unusual surge in positive market breadth. Such events stand out historically as rare occurrences, often clustering around periods of heightened market activity or recovery phases. The first chart illustrates the performance of the Russell 2000 on a log scale since 2010, with red dots marking each day when the index's breadth reading was in the 99th percentile or higher.
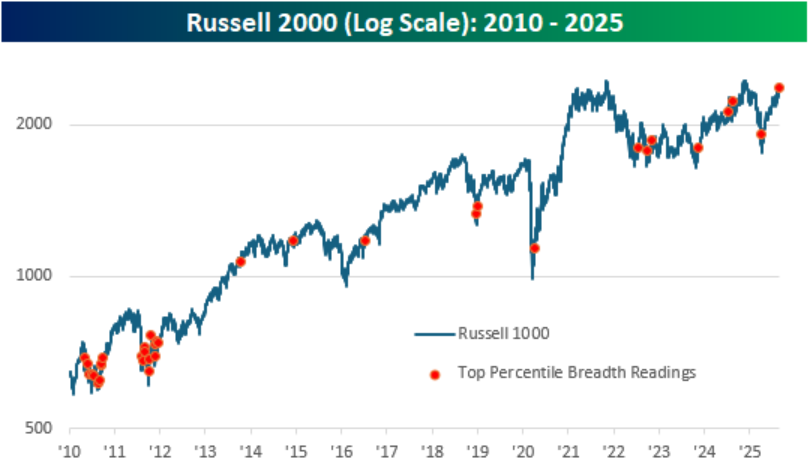
Source: Bespoke Investment Group
These episodes of widespread participation in small-cap rallies typically correlate with superior forward returns over multiple time horizons. In the table below, we have listed the dates of each time the Russell 2000 had a top-percentile daily breadth reading with no other occurrences in the prior three months. For each day, we then include the Russell 2000’s forward returns over the following year.
Analysis of such instances reveals that immediately following these broad surges, returns tend to be far above average over all periods of one-week, one-month, three-month, six-month, and one year later. The six-month subsequent outperformance is particularly striking, with positive returns occurring 100% of the time and average returns of 13.10% compared to average returns for all periods since 2010 of 4.73% with positive returns just 65% of the time, highlighting a sustained momentum effect. Even over the one-year horizon, returns tend to significantly outpace typical long-term averages, with only occasional minor declines, as shown by the average return of 21.66% with positive returns 80% of the time, compared to all periods average since 2010 of just 9.93% with positive returns only 69% of the time.
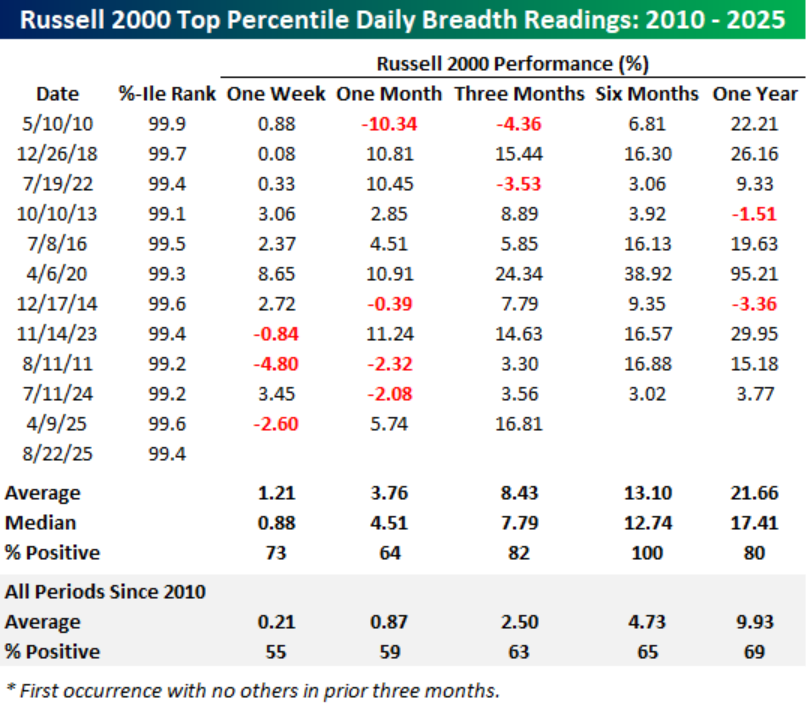
Source: Bespoke Investment Group
This pattern suggests that these breadth-driven rallies reflect broader shifts beyond transient price movements, potentially indicating improved fundamentals or a collective revaluation of smaller companies. This could also be an indicator that markets are rotating away from large-cap tech stocks in favour of other strategies, including small and medium-cap companies. Overall, market breadth in small-cap indices serves as a powerful gauge of underlying market dynamics, where extensive, one-day rallies are infrequent but meaningful markers that often precede sustained gains, making them a critical element in understanding equity market trend development.
Sources: Yahoo Finance, Reuters, The Canadian Press, The Financial Post, Bespoke Investment Group, CBC, First Trust
©2025 Milestone Wealth Management Ltd. All rights reserved.
DISCLAIMER: Investing in equities is not guaranteed, values change frequently, and past results are not necessarily an indicator of future performance. Investors cannot invest directly in an index. Index returns do not reflect any fees, expenses, or sales charges. Opinions and estimates are written as of the date of this report and may change without notice. Any commentaries, reports or other content are provided for your information only and are not considered investment advice. Readers should not act on this information without first consulting Milestone, their investment advisor, tax advisor, financial planner, or lawyer. This communication is intended for Canadian residents only and does not constitute as an offer or solicitation by anyone in any jurisdiction in which such an offer is not allowed.