Market Insights: U.S. Housing Stability
Milestone Wealth Management Ltd. - Aug 15, 2025
Macroeconomic and Market Developments:
- North American markets were up this week. In Canada, the S&P/TSX Composite Index closed 0.53% higher. In the U.S., the Dow Jones Industrial Average rose 1.74% this week and the S&P 500 Index increased 0.94%.
- The Canadian dollar was relatively still again, closing at 72.40 cents vs 72.68 cents USD last week.
- Oil prices fell once again, but only slightly this week, with U.S. West Texas crude closing at US$63.13 vs US$63.61 last week.
- The price of gold declined this week, closing at US$3,383 vs US$3,453 last week.
- In the U.S., Inflation in July came in exactly as expected, with the CPI rising 0.2% and core CPI increasing 0.3%, leaving annual rates at 2.7% and 3.1%, respectively. Since January — even with higher tariffs — overall inflation has averaged just 1.9% annualized and core 2.4%, reinforcing that tariffs don’t cause broad inflation; they shift prices within categories rather than lifting the overall level. July’s increase was led by services like airline fares (+4.0%) and dental services (+2.6%), not goods typically affected by tariffs. Real wages continued to improve, with average hourly earnings up 1.2% from a year ago. With money supply growth subdued, “supercore” inflation running at 1.9% annualized, and economic growth slowing, the Fed has ample room to begin cutting rates — and risks being late to act if it waits beyond September.
- Producer prices surged 0.9% in July — the largest monthly gain in over three years — but the data doesn’t alter the broader picture of moderating inflation. Energy (+0.9%) and food (+1.4%) drove much of the increase, while core PPI also rose 0.9% but is up just 3.7% over the past year. Goods prices, the most exposed to tariffs, remain tame, rising only 0.7% in July and just 0.7% annualized over the past six months. The bigger driver was services (+1.1%), particularly trade margins. As with CPI, tariffs shift prices between categories but don’t lift the overall inflation trend, which remains anchored by slow money supply growth (+1.2% since April 2022).
- Retail sales rose 0.5% in July and, with upward revisions to prior months, posted a solid 0.9% gain, marking the second straight monthly increase. Sales were higher in nine of thirteen major categories, led by a 1.6% jump in autos, the strongest since March. Core sales (excluding autos, building materials, and gas) climbed 0.3% in July and are up 4.9% year-over-year, outpacing the 3.9% gain for overall sales. While tariff-related buying patterns have added some volatility this year, the broader trend shows consumers are still willing to spend, particularly on goods. Even restaurant and bar sales, which dipped 0.4% in July, remain up at a 5.5% annual pace so far in 2025.
- AI startup Perplexity has offered $34.5B to acquire Google’s Chrome browser, backed by major VC investors. The bid comes as a U.S. judge weighs forcing a sale of Chrome to address antitrust concerns, although Google has shown no interest in selling.
- In Canada, National home sales rose 3.8% from June and 6.6% year-over-year, according to the Canadian Real Estate Association. The Home Price Index was flat month-over-month and down 3.4% from July 2024, while the national average selling price edged 0.6% higher versus last year.
Weekly Diversion:
Check out this video: Thinking About Going on a Hike?
Charts of the Week:
The U.S. housing market in 2025 presents a complex picture, often misunderstood by those expecting a repeat of the mid-2000s collapse. While price growth has slowed considerably compared to the pandemic surge, the overall conditions point more toward stabilization than freefall.
One major factor shaping today’s market is the prevalence of fixed-rate mortgages, most of which were secured during the historically low-interest-rate era before 2022 as the first chart depicts. The average mortgage rate across existing loans is far below current borrowing costs, creating a “lock-in effect” where homeowners are reluctant to sell, thereby restricting available supply. It is also important to note that unlike Canada, mortgage terms in the U.S. are much longer, eliminating the renewal shock at higher rates. This structural constraint has kept inventory from ballooning, despite higher interest rates, reducing buyer demand.
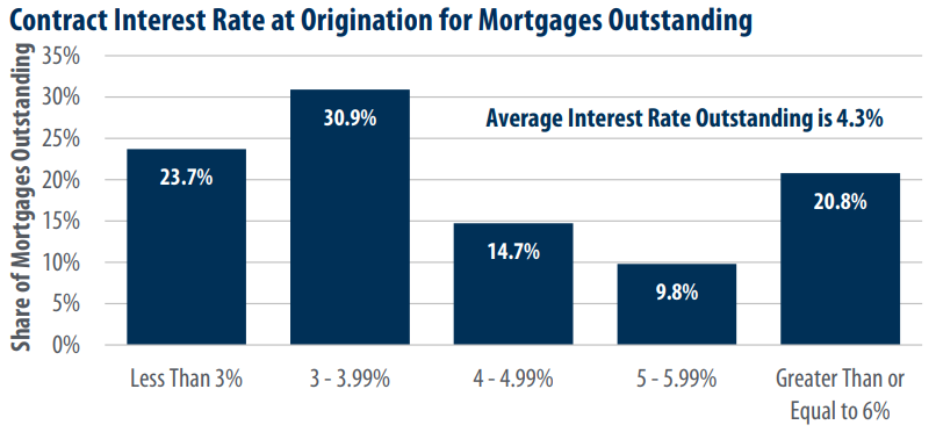
Source: Federal Housing Finance Agency, First Trust Advisors, Data as of Q1 2025
While U.S. property listings have increased compared to last year, they remain below pre-pandemic norms, as illustrated by the next chart. The rise in supply is better viewed as a gradual normalization rather than the start of an oversupply-driven downturn. With inventories are still tighter than historical averages, the market retains a degree of balance that limits the downside risk for prices.
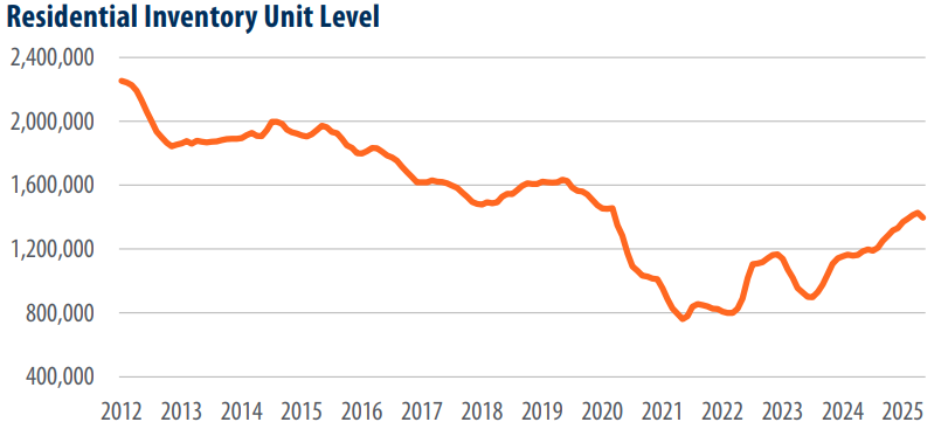
Source: Redfin, First Trust Advisors, Monthly data 01/2012- 05/2025
Additionally, homeowners’ financial positions today are markedly stronger than in past cycles. After years of steady appreciation and generally conservative lending practices, U.S. household equity in real estate has reached 72% of total home values, one of the highest shares on record dating back to the 1960s, as shown in the last chart. This cushions the market against widespread distress sales, in sharp contrast to the heavily leveraged environment that fueled the last major housing crash.
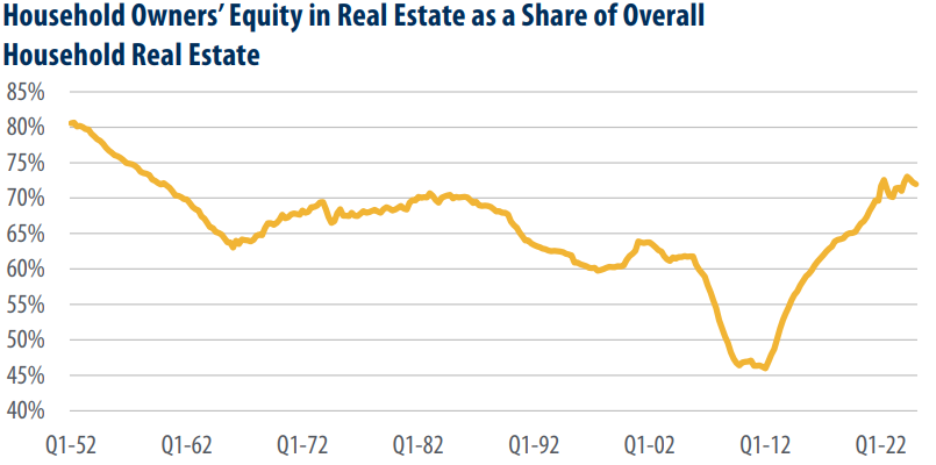
Source: Federal Reserve Board, First Trust Advisors, Quarterly data from Q1 1952- Q1 2025
To conclude our final thoughts, while headwinds from elevated mortgage rates and softening demand are real, the underlying fundamentals—tight supply, solid homeowner balance sheets, and significant equity—make a broad-based collapse unlikely. The more probable scenario is one of subdued price movement, with modest gains and relative stability over the next several years.
Sources: Yahoo Finance, Reuters, Investing.com, Federal Housing Finance Agency, First Trust Advisors, Redfin, Federal Reserve Board
©2025 Milestone Wealth Management Ltd. All rights reserved.
DISCLAIMER: Investing in equities is not guaranteed, values change frequently, and past results are not necessarily an indicator of future performance. Investors cannot invest directly in an index. Index returns do not reflect any fees, expenses, or sales charges. Opinions and estimates are written as of the date of this report and may change without notice. Any commentaries, reports or other content are provided for your information only and are not considered investment advice. Readers should not act on this information without first consulting Milestone, their investment advisor, tax advisor, financial planner, or lawyer. This communication is intended for Canadian residents only and does not constitute as an offer or solicitation by anyone in any jurisdiction in which such an offer is not allowed.