Market Insights: Three Signals for Future Growth
Milestone Wealth Management Ltd. - Jul 18, 2025
Macroeconomic and Market Developments:
- North American markets were mixed this week. In Canada, the S&P/TSX Composite Index closed 1.08% higher, after closing down 0.05% last week. In the U.S., the Dow Jones Industrial Average fell 0.07%, after closing down 1.02% last week & the S&P 500 Index increased 0.59%, after closing down 0.31% last week.
- The Canadian dollar shrank slightly this week, closing at 72.90 cents vs 73.00 cents last week.
- Oil prices waned this week, with U.S. West Texas crude closing at US$67.38 vs US$68.75 last week.
- The price of gold softened this week, closing at US$3,356 vs US$3,364 last week.
- Canada’s annual inflation rate rose to 1.9% in June, up from 1.7% in May, led by higher gas, car, and furniture prices. While the headline figure remains below the Bank of Canada’s 2% target, core inflation remains sticky — CPI-median rose to 3.1%. Economists now see little chance of a July rate cut, especially after last week’s surprise jobs surge. With shelter and durable goods inflation still elevated and trade-related price pressures emerging, the BoC appears likely to hold rates steady until deeper disinflation takes hold.
- Canada added 83,000 jobs in June (70,000 were part-time), dropping the unemployment rate to 6.9% and marking the first monthly job gain since January. Core-aged workers (25–54) drove much of the growth, with strong hiring in retail, healthcare, manufacturing, and food services. Student summer employment continues to struggle, with the youth unemployment rate hitting 17.4% — its highest June level since 2009 (excluding the pandemic). While the strength in jobs reduces the urgency for Bank of Canada rate cuts, uncertainty from ongoing trade tensions continues to cloud the outlook.
- After two straight monthly declines, U.S. retail sales surprised to the upside in June, rising 0.6% led by gains in auto, clothing, and restaurant spending. Consumers remained active despite inflationary pressures and tariff concerns, prioritizing necessities but still showing strength in discretionary categories like dining and online shopping. Economists warn the upbeat data may give policymakers false confidence, but analysts say the American consumer remains the backbone of the economy heading into the back-to-school season.
- U.S. headline inflation rose 0.3% in June, in line with expectations, pushing the annual CPI rate to 2.7%. Core inflation (excluding food and energy) came in softer at 0.2% for the month, with the year-over-year rate at 2.9%. Energy prices rose 0.9%, while food increased 0.3%. Notably, prices for new and used vehicles continued to decline. "Supercore" inflation—closely watched by the Fed—has slowed sharply to a 1.1% annualized pace over the last five months. Real wages dipped slightly in June but remained positive year-over-year. The trend supports the case for the Fed to begin easing rates later this year as inflation shows signs of cooling.
- After intense negotiations, the U.S. House is expected to pass major crypto legislation, including a regulatory framework for dollar-pegged stablecoins—marking the first comprehensive crypto law in U.S. history. The bill, already approved by the Senate, is likely to be signed by President Trump as soon as Friday. To appease conservative Republicans, lawmakers also agreed to add a ban on a U.S. central bank digital currency to a separate defense bill, clearing the way for final passage of the crypto package.
- Netflix (NFLX) reported strong second-quarter 2025 results, surpassing analyst expectations with earnings of $7.19 per share and revenue of $11.08 billion, marking a nearly 16% increase from the same period last year. Net income rose significantly to $3.1 billion, up from $2.1 billion a year earlier. The company also raised its full-year revenue forecast to a range of $44.8 billion to $45.2 billion, attributing the improved outlook to a weaker U.S. dollar, solid subscriber growth, and strong advertising performance.
Weekly Diversion:
Check out this video: James Webb Space Telescope New Images 2025
Charts of the Week:
In the current market landscape, several compelling indicators suggest that U.S. equity prices may continue to rise through the remainder of 2025. These arguments stem from a mix of recent technical signals, historical market behavior, and sentiment dynamics that together paint a constructive outlook for investors.
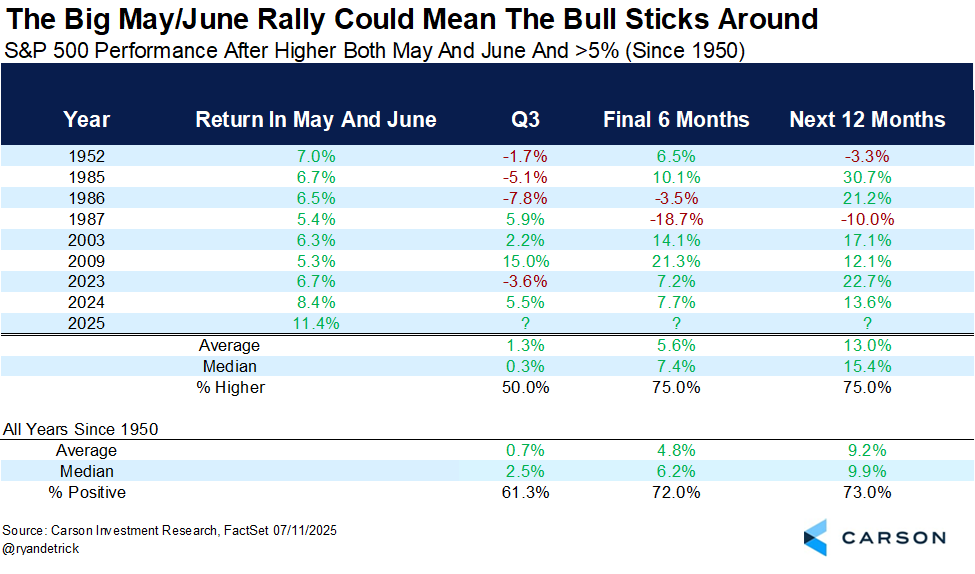
One relevant development was the exceptionally strong performance of the stock market during May and June of this year. These months, which have historically delivered more modest returns, saw one of their best performances on record. Past instances where such strength occurred during these months have often been followed by above average gains, both in the remainder of the year and into the following 12 months, with average returns for the S&P 500 Index of 5.6% and 13.0% respectively, compared to 4.8% and 9.2% for all years since 1950 as the next table shows. This pattern supports the idea that current momentum could carry forward.
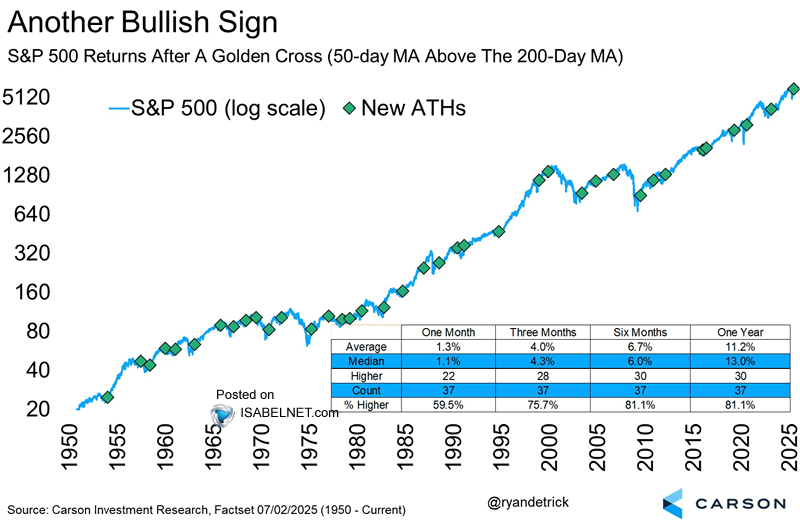
Next, a key technical indicator, known as the “golden cross,” recently materialized. This occurs when the 50-day moving average (MA) of the market’s price rises above the 200-day MA, signaling a shift in the trend’s intermediate-term direction. Historically, when this signal appears, it has often marked the beginning or continuation of significant bull runs, with strong odds of positive returns in subsequent months. As next chart illustrates, the average 12-month return after this indicator has averaged 11.2% with positive returns 81.1% of the time. We will also point out that the 50-day MA for the S&P/TSX Composite in Canada never even crossed below its 200-day MA at all this year to begin with, signaling an even stronger equity market here.
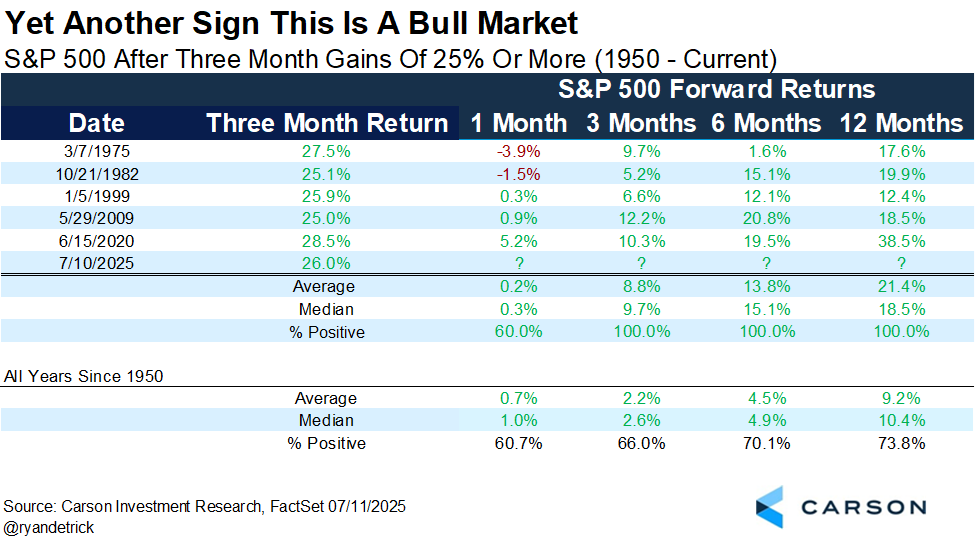
Lastly, another positive sign is the recent sharp rebound in equity prices following a steep selloff earlier in the year. Historically, markets that rally more than 25% within a three-month window—particularly after major declines—have tended to build on their gains rather than retrace them. As the next table shows, last week was only the sixth time this has ever happened since 1950. Previous examples of such rebounds occurred after notable market lows, including the mid-1970s, early 1980s, and post-2008 periods. All of those instances led to sustained upward trends over the following year, with 12-month average returns of 21.4% and positive returns each time compared to the 12-month average return of 9.2% and positive returns just 73.8% of the time for all years.
While past results are not necessarily an indicator of future performance, taken together, these factors—seasonal strength, bullish technical signal, and powerful rebound pattern—provide a data-backed case for continued market appreciation in the second half of 2025.
Sources: Yahoo Finance, Global, First Trust, Investment Executive, Reuters, Carson Investment Research, FactSet, @ryandetrick
©2025 Milestone Wealth Management Ltd. All rights reserved.
DISCLAIMER: Investing in equities is not guaranteed, values change frequently, and past results are not necessarily an indicator of future performance. Investors cannot invest directly in an index. Index returns do not reflect any fees, expenses, or sales charges. Opinions and estimates are written as of the date of this report and may change without notice. Any commentaries, reports or other content are provided for your information only and are not considered investment advice. Readers should not act on this information without first consulting Milestone, their investment advisor, tax advisor, financial planner, or lawyer. This communication is intended for Canadian residents only and does not constitute as an offer or solicitation by anyone in any jurisdiction in which such an offer is not allowed.