Market Insights: July Seasonal Performance
Milestone Wealth Management Ltd. - Jul 04, 2025
Macroeconomic and Market Developments:
- North American markets rose this week. In Canada, the S&P/TSX Composite Index closed 1.29% higher. In the U.S., the Dow Jones Industrial Average was up 2.30% & the S&P 500 Index increased 1.72%
- The Canadian dollar moved higher this week, closing at 73.50 cents vs 72.95 cents last week.
- Oil prices improved this week after a huge drop the week prior, with U.S. West Texas crude closing at US$66.50 vs US$65.13 last week.
- The price of gold rallied this week, closing at US$3,337 vs US$3,283 last week.
- Canadian PM Mark Carney scrapped a planned 3% digital services tax on U.S. tech companies which had been opposed by Donald Trump and led to the suspension of trade talks between the two countries.
- The United States and Vietnam have agreed to a new trade deal that imposes a 20% tariff on Vietnamese exports to the U.S. and a 40% tariff on goods deemed transshipped through Vietnam, while eliminating all Vietnamese tariffs on U.S. goods.
- U.S. jobs numbers showed surprising resilience in June. Nonfarm payrolls increased 147,000 in June, beating the expected 106,000. Additionally, April and May’s numbers were revised up by a total of 16,000. The unemployment rate dropped to 4.1% from 4.2% whereas the consensus was for it to increase to 4.3%.
- Microsoft announced it will lay off another 9,000 employees, particularly by reducing management layers. The move follows previous job cuts earlier this year, bringing the total to over 15,000 layoffs in 2025.
- The ISM Services index’s brief one-month stint below 50 in May proved to be short-lived as the U.S. services sector bounced back. The ISM Non-Manufacturing (Services) index increased to 50.8 in June, narrowly beating the expected 50.6 (levels above 50 signal expansion).
Weekly Diversion:
Check out this video: Human Dominos
Charts of the Week:
July has consistently delivered stronger returns for the S&P 500 than other summer months, making it the best-performing month of the season, with average gains outpacing both June and August. The following chart highlights the S&P 500’s historical performance by month and July (in gray) emerges as a particularly strong month for the index, ranking as the fourth-best month since 1945 with an average gain of 1.2%. Over the last 25 years, July’s average return has increased to 1.5% on average, making it the third-best month, and in the past decade, the average return jumps to 3.4%, second only to November’s 4.1%. Notably, the S&P 500 has posted positive gains in July for each of the last ten years, underscoring the month’s consistent bullishness.
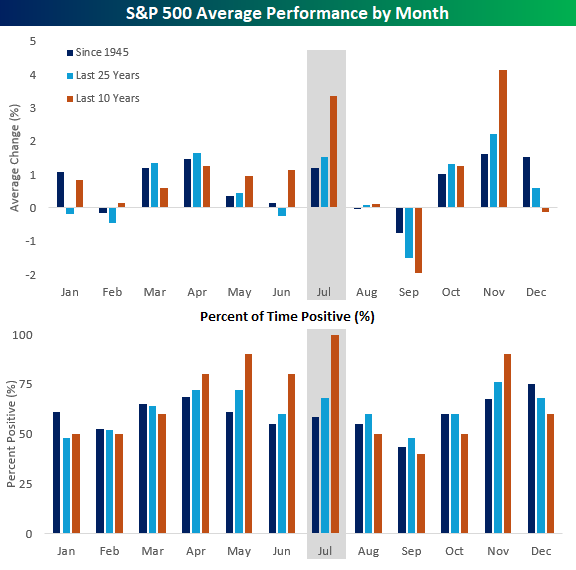
Source: Bespoke Investment Group
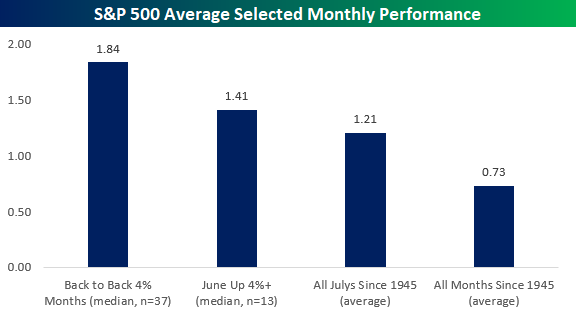
July has also shown strong intraday and momentum-driven patterns. Historically, July begins with robust performance, levels off mid-month as earnings season commences, and then rallies in the final week, often finishing near the month’s highs. Importantly, when the S&P 500 experiences back-to-back monthly gains of over 4%—as seen in May and June—July’s median performance tends to exceed its historical average, as shown in the first chart below. Similarly, the second chart below highlights the S&P 500’s intraday performance in July, comparing data from 1983 onward to the last ten years. In both timeframes, July has historically been a strong month for the index, with similar patterns emerging. The main difference between the two periods is the magnitude of the gains—over the past decade, July’s returns have been more than twice as large as the average since 1983, underscoring the recent strength of the market during this summer month while maintaining the same general pattern.
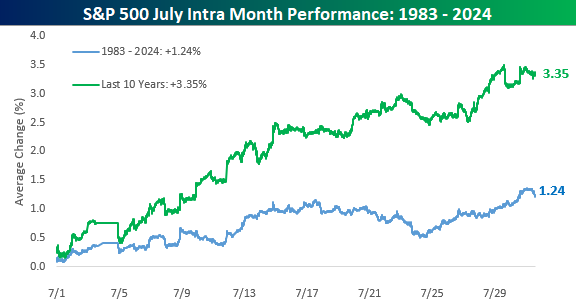
Source: Bespoke Investment Group
Sources: Yahoo Finance, CBC, First Trust, CNBC, Bespoke Investment Group, Barchart
©2025 Milestone Wealth Management Ltd. All rights reserved.
DISCLAIMER: Investing in equities is not guaranteed, values change frequently, and past results are not necessarily an indicator of future performance. Investors cannot invest directly in an index. Index returns do not reflect any fees, expenses, or sales charges. Opinions and estimates are written as of the date of this report and may change without notice. Any commentaries, reports or other content are provided for your information only and are not considered investment advice. Readers should not act on this information without first consulting Milestone, their investment advisor, tax advisor, financial planner, or lawyer. This communication is intended for Canadian residents only and does not constitute as an offer or solicitation by anyone in any jurisdiction in which such an offer is not allowed.