Market Insights: Markets Following a Historic Midterm Election
Milestone Wealth Management Ltd. - Nov 06, 2026
Steve Nielsen, B.Comm, CFP®, CIM®, Chief Investment Officer. Week ending November 6, 2026.
Three Things to Know
U.S. Jobs
Payrolls rose 165,000 in October, well above the 65,000 expected, lifting the odds of a December Fed hike to 76.8%.
Canada’s Labour Market
Canada shed 4,700 jobs in October, a third straight monthly decline, pushing unemployment to a six-month high of 6.7%.
Midterms and Markets
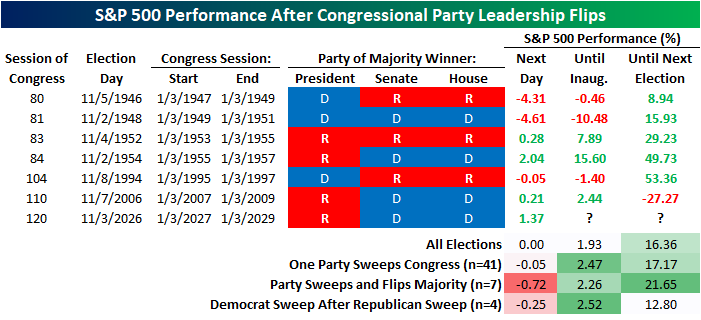
In the six prior elections where both chambers flipped, the S&P 500 averaged a 21.65% gain through the next election.
The Week at a Glance
S&P/TSX Composite
+0.47%
on the week
S&P 500
-2.68%
on the week
Dow Jones Industrial
-0.94%
on the week
Canadian Dollar
70.83¢
vs. 71.58¢ USD
WTI Crude
$90.56
vs. $103.73 USD
Gold
$4,075
vs. $3,919 USD
Recent Insights
Macroeconomic & Market Developments
- The U.S. economy added 165,000 jobs in October, significantly exceeding expectations of 65,000, while the unemployment rate declined to 4.1% from 4.2% in September. Previous employment figures were also revised higher, adding 84,000 jobs to August and September’s combined totals, suggesting greater labour market strength than initially reported. Job creation was led by professional and business services (+70,000), healthcare (+41,600) and manufacturing (+19,000). Meanwhile, average hourly earnings increased 0.4% for the month and 3.1% year-over-year, indicating continued wage growth. Despite the strong headline figures, the number of Americans working part-time for economic reasons increased by 339,000. The stronger-than-expected employment report also reinforced expectations of further Federal Reserve tightening, with markets pricing in a 76.8% probability of a 25-basis-point rate hike in December, up from 66.9% the previous week.
- U.S. manufacturing activity strengthened in October, while growth in the services sector moderated, with both remaining firmly in expansion territory. The ISM Manufacturing Index rose to 55.5 from 54.5, its second-strongest reading since 2022, supported by accelerating production (59.0) and stronger new orders (55.5). Meanwhile, the ISM Services Index declined to 54.5, marking its second consecutive monthly decline, as business activity and new orders softened. Despite diverging trends, employment continued expanding across both sectors, suggesting underlying economic resilience. However, inflationary pressures remain elevated, with the manufacturing and services prices-paid indexes registering 75.2 and 73.0, respectively, reflecting continued pressure from energy costs, tariffs and higher input prices. The reports suggest the U.S. economy remains resilient, although persistent cost pressures could reinforce expectations for additional Federal Reserve tightening in December.
- Canada’s economy lost 4,700 jobs in October, marking a third consecutive month of employment declines, while the unemployment rate rose to 6.7%, its highest level in six months. The disappointing report fell short of expectations for 13,600 new jobs and brings total employment losses since August to approximately 115,000 positions. Particularly concerning was the loss of 53,000 private-sector jobs, partially offset by 50,000 new public-sector positions, while wholesale and retail trade shed 29,000 jobs. Youth unemployment also climbed to 13.7%, and annual wage growth slowed to 2.2%. The continued deterioration highlights growing weakness beyond industries directly exposed to U.S. tariffs and complicates the Bank of Canada’s interest rate outlook following its recent hike to 2.50%. Markets now assign just a 35% probability of another rate hike in December, reflecting concerns about further economic weakness.
- Canada and China have agreed to extend their trade agreement through the end of 2028, maintaining favourable Chinese market access for Canadian canola meal, peas, lobster and crab in exchange for continued Canadian tariff exemptions on certain Chinese steel and aluminum products. Since the arrangement took effect in March, Canadian canola seed exports to China have increased 84%, reaching $1.91 billion, while canola meal exports more than doubled to $390 million and lobster exports rose 57%. The extension provides greater certainty for Canadian agricultural producers and supports Ottawa’s goal of increasing exports to China by 50% by 2030, as Canada looks to diversify trade beyond the United States. However, closer economic ties with Beijing could complicate ongoing trade negotiations with Washington, particularly regarding Chinese steel and aluminum access to Canadian markets.
Weekly Diversion
Charts of the Week
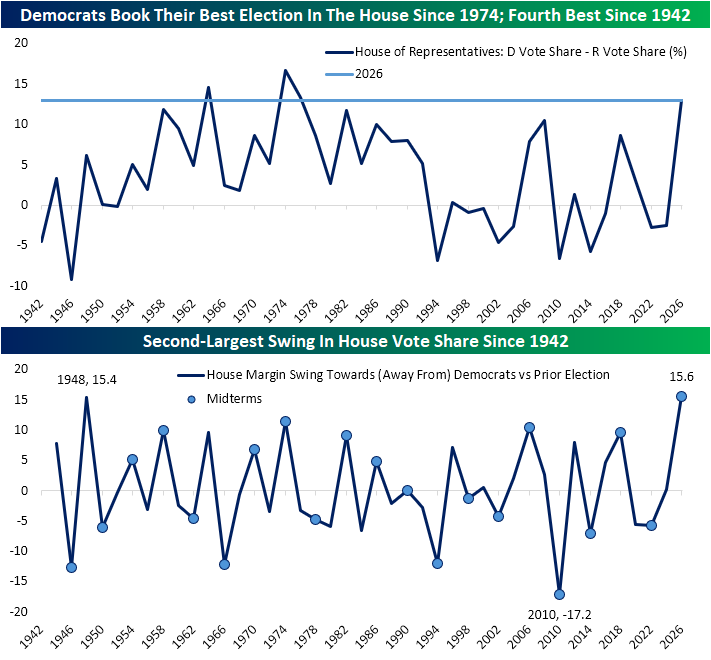
The 2026 U.S. midterm elections brought a significant shift in the political landscape, with Democrats gaining control of both chambers of Congress. According to Bespoke Investment Group, Democrats received approximately 13 percentage points more of the House popular vote than Republicans, marking their strongest performance since 1974 and fourth best since 1942. The change from the previous election was equally notable, with a 15.6-percentage-point swing in the House vote margin toward Democrats. This marked the largest shift in their favour since at least 1942 and the second-largest swing for either party during that period, behind only the Republican swing in the 2010 midterm elections.
Source: Bespoke Investment Group
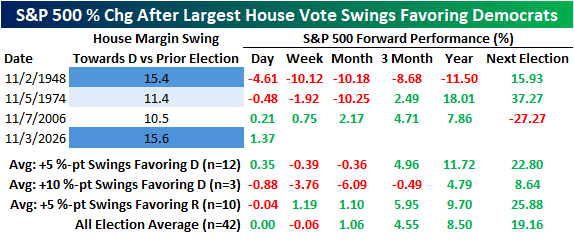
While the election results were historically significant, what do such large political shifts mean for financial markets? Looking back at elections since 1942, the S&P 500 has generally delivered positive returns following substantial swings toward either party. In elections where the House vote margin shifted at least five percentage points toward Democrats, the S&P 500 gained an average of 11.72% over the following year, compared with 9.70% following similarly sized Republican swings. However, the three previous Democratic swings exceeding 10 percentage points (like this time) were followed by a more modest average one-year gain of 4.79%. With so few comparable elections, these results provide historical context only rather than a reliable prediction.
Source: Bespoke Investment Group
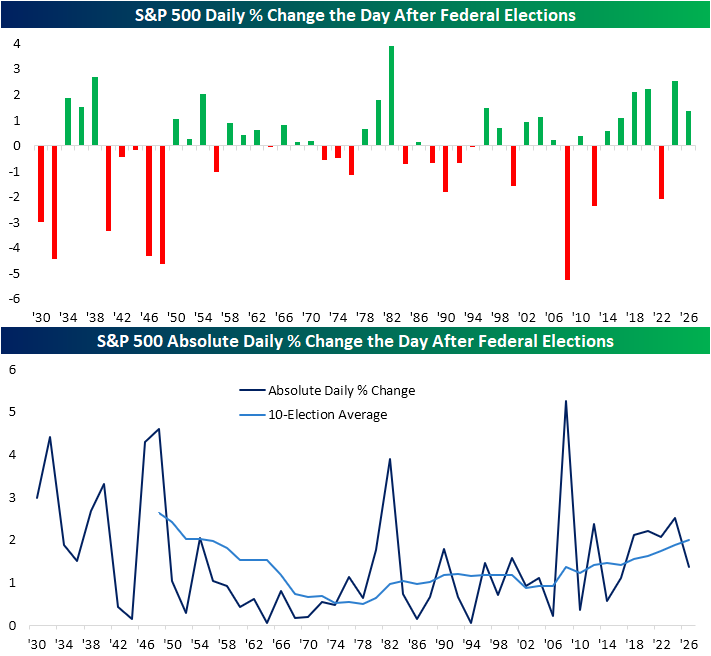
The immediate market reaction to election results has also changed over time. Bespoke's analysis shows that daily movements in the S&P 500 following federal elections have generally become larger in recent decades. At the time of its November 4 report, the S&P 500 was trading approximately 1.37% higher following the election. Although a meaningful daily gain, this was relatively modest compared with some recent post-election market reactions. The historical data illustrates that even significant political developments do not always produce unusually large market movements.
Source: Bespoke Investment Group
Another interesting comparison comes from elections where control of both the House and Senate switched from one political party to the other. Including 2026, this has occurred just seven times over the past century, with the previous instance taking place in 2006. Across the six earlier transitions, the S&P 500 gained an average of 21.65% between Election Day and the following federal election. Five of those six periods produced positive returns, with the exception being the 2006–2008 period, which coincided with the global financial crisis. While these historical results are encouraging, the limited number of occurrences makes it difficult to draw any firm conclusions.
Source: Bespoke Investment Group
What This Means for Investors
For investors, the takeaway is that major political changes do not necessarily translate into negative market performance. Historically, stocks have often performed well following significant election swings and changes in congressional leadership, regardless of which party gained control. Although election outcomes can influence government policy and investor expectations, history suggests that political developments alone are not reliable indicators of future market direction. Maintaining a long-term perspective remains important, particularly during periods of heightened political uncertainty.
Sources: Yahoo Finance, First Trust, BNN Bloomberg, The Canadian Press, Fox Business, Bespoke Investment Group.
Milestone Recession Risk™ Composite

As of November 6, 2026
What it is: A rules-based dashboard we use to watch for recessions and decide when to take risk off the table.
Why it matters to you: No one can predict every market dip, and we don’t try to. The Composite gives us a disciplined way to respond when the evidence points to rising recession risk, so decisions rest on data rather than headlines.
DISCLAIMER: Investing in equities is not guaranteed, values change frequently, and past results are not necessarily an indicator of future performance. Investors cannot invest directly in an index. Index returns do not reflect any fees, expenses, or sales charges. Opinions and estimates are written as of the date of this report and may change without notice. Any commentaries, reports or other content are provided for your information only and are not considered investment advice. Readers should not act on this information without first consulting Milestone, their investment advisor, tax advisor, financial planner, or lawyer. This communication is intended for Canadian residents only and does not constitute as an offer or solicitation by anyone in any jurisdiction in which such an offer is not allowed.