Market Insights: A Tale of Two Markets
Milestone Wealth Management Ltd. - Oct 16, 2026
Macroeconomic and Market Developments:
- North American markets were mixed over the last two weeks. In Canada, the S&P/TSX Composite Index rose by 1.90% over that period, while in the U.S., the Dow Jones Industrial Average increased by 1.61% and the S&P 500 Index fell by 0.82%.
- The Canadian Dollar increased over the last two weeks, closing at 70.68 vs. 70.17 cents USD.
- Oil prices jumped over the last two weeks, with U.S. West Texas Crude closing at US$98.99 vs. US$91.48.
- The price of Gold rose slightly over the last two-week period closing at US$4,188 vs. US$4,171.
- U.S. retail sales increased 0.8% in September, beating expectations of 0.3%, with sales rising 6.3% year-over-year. However, much of the headline strength was driven by a 6.4% surge in gasoline station sales, largely reflecting higher fuel prices rather than stronger underlying demand. Spending increased in eight of thirteen major categories, including restaurants and bars (+1.1%), while miscellaneous retailers declined 3.0%. Core retail sales, excluding autos, building materials and gasoline, rose a more modest 0.3%, although they increased at a solid 5.7% annualized rate in Q3 compared with Q2. After adjusting for inflation, retail sales were up 2.5% year-over-year, suggesting consumer spending remains resilient despite higher prices, although the headline figures somewhat overstate the strength of underlying consumption.
- U.S. consumer prices rose 0.6% in September, matching expectations and pushing annual inflation to 3.7%, as higher energy costs continued to pressure household budgets. Energy prices surged 5.2% for the month, including a 9.1% increase in gasoline prices, which accounted for more than half of the headline CPI increase. However, underlying inflation also remained persistent, with core CPI rising 0.3%, above expectations of 0.2%, and 2.6% year-over-year. Price increases in housing, airfare, hotels and used vehicles contributed to the elevated reading. Meanwhile, inflation-adjusted hourly earnings declined 0.5% in September and 0.7% year-over-year, highlighting the continued erosion of consumer purchasing power. The report reinforces concerns about persistent inflation and complicates the Federal Reserve’s policy outlook, particularly as higher energy prices coincide with continued strength in consumer spending.
- Canada lost 68,300 jobs in September, significantly worse than expectations for a 9,200-job gain, pushing the unemployment rate to 6.5% from 6.4% in August. Combined with August’s 41,700 job losses, the economy has shed approximately 110,000 positions in two months, leaving employment down 41,200 year-to-date and erasing earlier gains. Notably, the largest declines occurred outside tariff-exposed industries, with education losing 35,000 jobs and healthcare and social assistance shedding 23,000, compared with 12,700 in manufacturing. Youth employment also fell sharply by 48,000 positions, while labour force participation declined to 64.8%, its lowest level since 1997 outside the pandemic. The deteriorating labour market raises concerns about Canadian economic momentum and complicates the Bank of Canada’s interest rate outlook, as policymakers balance weakening employment against persistent inflationary pressures.
- Tesla unveiled its long-awaited next-generation Roadster, featuring SpaceX-developed compressed-air thrusters capable of launching the vehicle briefly into the air, sending shares up as much as 5.4% in premarket trading following the demonstration. The prototype reportedly accelerated from 0–60 mph in just 0.81 seconds and demonstrated the ability to drive upside down, perform mid-air rotations and land using its thrusters. Tesla announced three configurations, including a Rocket version designed for limited airborne manoeuvres, with production targeted for 2028. The unveiling comes nearly nine years after the Roadster was first announced in 2017, following multiple production delays. While the demonstration highlights Tesla’s engineering capabilities and collaboration with SpaceX.
Weekly Diversion:
Check out this video: Top 10 Dog and News Reporter Interaction
Charts of the Week:
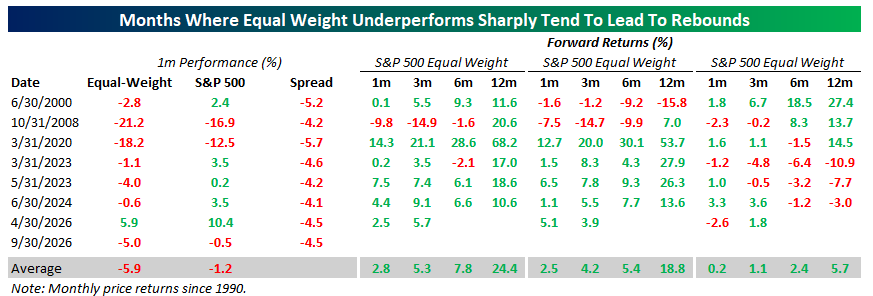
September highlighted an interesting divide within the U.S. stock market. While the traditional S&P 500 Index declined just 0.5% during the month, its equal-weight counterpart fell 5.0%. The difference comes down to how the indices are calculated. The traditional S&P 500 gives larger companies more influence over performance, while the equal-weight version gives each company the same importance. In other words, September was considerably weaker for the average stock than the headline index suggested, indicating weak market breadth.
Source: Bespoke Investment Group
**Chart typo – Forward Returns (%) title on Column 2 should say S&P 500 (not equal) and Column 3 is the outperformance of the Equal Weight over the Market Weight.**
This 4.5 percentage-point gap was unusual. Since 1990, there have been only seven other months when the equal-weight index underperformed the traditional S&P 500 by more than four percentage points. Historically, these periods have often been followed by positive market returns. Across the prior instances with a full year of subsequent data, the equal-weight S&P 500 gained an average of 24.4% over the following 12 months, compared with an average gain of 18.8% for the traditional index. While encouraging, the relatively small sample size means these results should be viewed with caution.
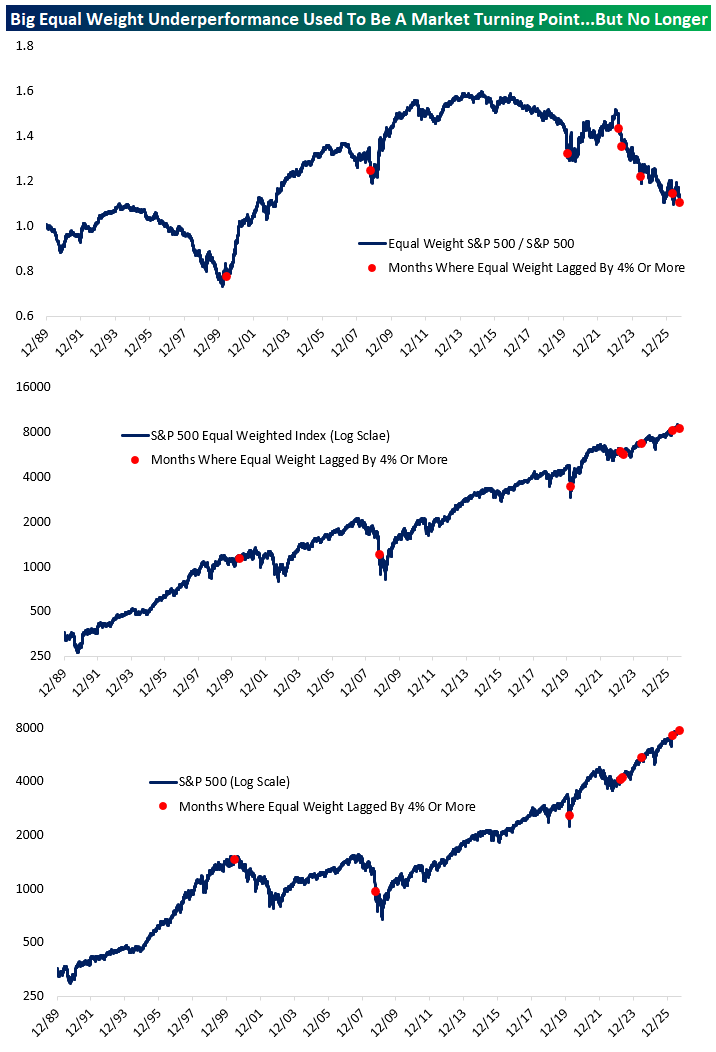
The longer-term charts below provide some important context. In 2000, 2008, and 2020, significant underperformance by the average stock occurred around major turning points in the market. However, similar episodes have become more frequent since 2023 and have not consistently signalled the same type of recovery. This suggests that the relationship between the largest companies and the broader market may be changing, with a smaller group of large companies having an increasingly significant influence on overall index performance.
Source: Bespoke Investment Group
For investors, the takeaway here is that headline market returns do not always tell the full story. The S&P 500 can appear relatively stable even when many of its underlying companies are struggling. While history suggests that periods of unusually weak equal-weight performance have sometimes been followed by strong recoveries, recent examples have been less predictable. This reinforces the importance of looking beyond the major indices, maintaining diversification, and understanding what is actually driving market performance.
Sources: Bloomberg, Yahoo Finance, First Trust, Reuters, Bespoke Investment Group
©2026 Milestone Wealth Management Ltd. All rights reserved.
DISCLAIMER: Investing in equities is not guaranteed, values change frequently, and past results are not necessarily an indicator of future performance. Investors cannot invest directly in an index. Index returns do not reflect any fees, expenses, or sales charges. Opinions and estimates are written as of the date of this report and may change without notice. Any commentaries, reports or other content are provided for your information only and are not considered investment advice. Readers should not act on this information without first consulting Milestone, their investment advisor, tax advisor, financial planner, or lawyer. This communication is intended for Canadian residents only and does not constitute as an offer or solicitation by anyone in any jurisdiction in which such an offer is not allowed.