Market Insights: Canada Tracks Its Best Quarter in Over Three Years
Milestone Wealth Management Ltd. - Aug 07, 2026
Macroeconomic and Market Developments:
- North American markets were up this week. In Canada, the S&P/TSX Composite Index grew by 2.47%, while in the U.S., the Dow Jones Industrial Average increased by 1.61% and the S&P 500 Index rose by 2.07%.
- The Canadian Dollar increased slightly this week, closing at 71.67 vs. 71.37 cents USD last week.
- Oil prices fell this week, with U.S. West Texas Crude closing at US$77.03 vs. US$84.56 last week.
- The price of Gold rose this week closing at US$4,404 vs. US$4,103 last week.
- Crude fell for three consecutive sessions as Washington, Tehran and Muscat moved toward an interim agreement to reopen the Strait of Hormuz. WTI traded near US$78 per barrel Thursday after Iran and Oman agreed on a shipping route through the strait, and Brent slipped below US$80 for the first time since hostilities resumed. President Trump called off a planned strike on Iran over the weekend, and Qatar has drafted a proposal for a 60-day reopening without transit tolls.
- The U.S. labour market weakened more than expected in July. Payrolls unexpectedly fell by 23,000 against forecasts for job gains near 100,000, and Labor Department revisions cut a further 103,000 from May and June. The unemployment rate dipped to 4.1%, the lowest since June 2025, but only because 264,000 people left the labour force, pushing participation down to 61.4%, the lowest since February 2021. Public schools shed 50,000 positions and retailers 19,000, while construction added 22,000 and factories 5,000, consistent with ISM manufacturing employment expanding for the first time in 34 months. Layoffs remain historically low, with initial jobless claims at 199,000 and Challenger reporting July announcements fell 27% to 33,429.
- Second-quarter productivity grew at a 1.4% annualized rate, more than double the 0.6% expected, holding unit labour costs to 1.3% and easing one source of inflation pressure ahead of the Fed's September meeting. The labour share of output fell to a record low 52.9%. Economists see early evidence AI adoption is lifting output per worker, though unit nonlabor payments surged 14.0%, the fastest in four years, which Santander's Stephen Stanley argues means contained wage pressure alone will not deliver 2% inflation.
- Canada's economy is tracking 3.4% annualized second-quarter growth, well above the Bank of Canada's 2.5% July projection and its best showing in more than three years. Real GDP rose 0.3% in May, beating expectations, led by a 1% gain in mining, quarrying and oil and gas extraction, with manufacturing up 0.3% and construction up 0.8%. A flash estimate points to another 0.2% gain in June. The rebound follows two quarters of contraction and ends recession talk, though CPA Canada's David-Alexandre Brassard cautions the August 19 tariff deadline clouds investment intentions.
- Canada added 75,000 jobs in July, far exceeding the 15,000 gain economists expected in a Reuters poll, with the unemployment rate ticking down to 6.4%, the lowest in two years and a third consecutive monthly decline. The gains were split between full and part-time work, led by wholesale and retail trade at 21,000. Employment is now up 181,000 since April. Average hourly wages rose 2.8% year-over-year, decelerating from 3.3% in June, which RBC's Nathan Janzen notes leaves a labour market that is improving but not yet strong.
- Attention in Ottawa has turned to August 19, when the U.S. is scheduled to impose 50% tariffs across three lists of Canadian imports covering dairy, electronics and telecom equipment, furniture, building materials, plastics, apparel and machinery inputs. Unlike earlier measures, these would not exempt CUSMA-compliant goods, and the White House has framed them as a response to provincial alcohol restrictions, dairy supply management and automotive quotas. Carney called negotiations constructive this week and said Canada's tone is already firm.
Weekly Diversion:
Check out this video: The Best Penalty Kick Strategy
Charts of the Week:
Three charts this week, all pointing the same direction. The first captures how unusual the recent rally has been, and the next two show the earnings backdrop underneath it.
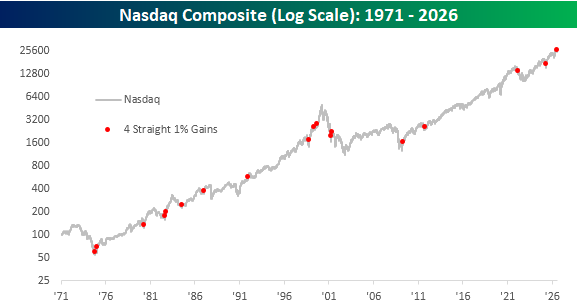
The Nasdaq Composite recently strung together four consecutive daily gains of 1% or more, running from July 30 through August 4. According to Bespoke Investment Group, it was just the 18th such streak since 1971, and the first since April 2025 when the market emerged from the tariff selloff. The following chart plots each prior occurrence on a long-term log scale price chart of the index.
Source: Bespoke Investment Group
What stands out is where these streaks have historically appeared. While they have occurred at all stages of the market cycle, they have clustered closer to market lows than market peaks, a pattern consistent with sharp advances emerging from oversold conditions. Across 15 independent prior instances, forward returns were meaningfully better than average. The median gain over the following week was 1.94%, compared with an average of 0.24% for all one-week periods since 1971, while median gains three, six and twelve months later were more than 10%, 20.2% and 27.4% respectively.
The current streak differs from most prior occurrences in one important respect. Rather than emerging from depressed levels, it took place with the index just 2.4% below its 52-week high, whereas prior streaks ended a median of more than 13% below their highs. Only three other instances began from within 5% of a high, and in those cases returns over the following week and month were negative before a median twelve-month gain of more than 40%. The sample is small, but it suggests near-term consolidation would not be unusual even if the longer-term signal remains constructive. Notably, the index has given back modest ground over the past two sessions while holding above the 26,000-level Bespoke flagged as support following the breakout.
Underneath the price action, the second quarter earnings season has been exceptionally strong. With more than 1,100 reports tracked, 78.0% of companies have beaten EPS estimates and 74.8% have beaten on revenue, placing both in the 94.9th and 92.9th percentiles respectively going back to 2001. The only season with a stronger EPS beat rate was the rebound from the initial Covid shock. Companies are not simply clearing a low bar either, as forward 12-month EPS estimates for the S&P 500 rose 9.6% over the second quarter and analysts have continued revising upward as results have come in.
Source: Bespoke Investment Group
Guidance activity has been even more encouraging, and is arguably the more forward-looking of the two measures. As the chart below shows, 14.2% of reporting companies have raised guidance, in the 90.9th percentile historically, while only 3.8% have cut, in the 10.1st percentile. The spread between raises and cuts ranks in the top 5% of all earnings seasons since 2001, exceeded only when management teams rapidly lifted forecasts coming out of the Covid shock.
Source: Bespoke Investment Group
For investors, the combination is a supportive one. A rare momentum signal in the index has historically been followed by above-average returns, and it is arriving alongside an earnings season delivering both better than expected results and rising forward expectations. The caveat is that the market enters this stretch already near its highs rather than recovering from a low, which has historically meant more modest near-term returns even when the longer-term picture held up. Short-term volatility should still be expected, but the fundamental backdrop supporting equities has strengthened rather than weakened.
Sources: Yahoo Finance, First Trust, BNN Bloomberg, Bespoke Investment Group, Reuters, Global News, Bank of Canada, CFIB
©2026 Milestone Wealth Management Ltd. All rights reserved.
DISCLAIMER: Investing in equities is not guaranteed, values change frequently, and past results are not necessarily an indicator of future performance. Investors cannot invest directly in an index. Index returns do not reflect any fees, expenses, or sales charges. Opinions and estimates are written as of the date of this report and may change without notice. Any commentaries, reports or other content are provided for your information only and are not considered investment advice. Readers should not act on this information without first consulting Milestone, their investment advisor, tax advisor, financial planner, or lawyer. This communication is intended for Canadian residents only and does not constitute as an offer or solicitation by anyone in any jurisdiction in which such an offer is not allowed.